Last year we released a new strategic plan for 2019-2022 to meet the CCTS goals of providing better quality service to our stakeholders while creating a more effective, efficient, transparent and accessible organization.
To support our strategic priorities, we are now conducting a detailed examination of our service delivery model to ensure our continued leadership in delivering the best possible service to customers and service providers.
We have retained a world-renowned consulting firm, cameron.ralph.khoury (CRK), to conduct the review of our operations. CRK brings extensive experience working with other dispute resolution organizations worldwide. After examining our service delivery processes as well as tools, CRK provided a report to the Board in August of 2020. We are reviewing their advice and recommendations.
In our expanding support of Canadian telecom and TV consumers, the CCTS began to administer the new CRTC Internet Code of Conduct in January of 2020. At the request of the CRTC, we also provided input to the CRTC Review of Mobile Wireless Services proceeding, informing the regulator that imposing aspects of proposed low-cost wireless plans would not prohibit us from accepting complaints about aspects of those plans. We continue to monitor other ongoing CRTC proceedings that may impact the CCTS, including proceedings about device financing plans, the provision of paper bills by communications service providers, and regulations to be made under the Accessible Canada Act.
The COVID-19 pandemic affected the CCTS, just as it did everyone else. The quick and effective transition to a safe work-from-home environment by CCTS management showed not only that the processes in place work but also the flexibility that allowed the quick implementation. The Board acknowledges and appreciates all the work that resulted in this successful undertaking.
As we move forward, there are upcoming changes to our Board. Two of our seven Board seats are reserved for representatives elected by Canadian consumer groups. The two current consumer group representatives will retire from the Board in October of 2020. I want to thank Jacques C. P. Bellemare and Marina Pavlović for their dedicated service of over six years. I also want to welcome the two newly elected directors, Geneviève Saumier and Catherine Middleton, who will assume their duties in October.
This year, more than ever before, I offer my heartfelt thanks to the Commissioner, Howard Maker, and all the CCTS team for their dedication and hard work. 2019-2020 has been a year like no other, and they have risen to the challenge brilliantly. With their ongoing efforts in changing times, I am confident that the CCTS will continue to help telecom and TV service providers meet the communications needs of Canadian consumers.
Catherine Aczel Boivie
Chair of the Board, CCTS
Commissioner’s Message
Annual Report
August 1, 2019 – July 31, 2020
For the first time since 2015-16, this year we are reporting a year-over-year decline in the number of complaints reaching the CCTS.
This year, we saw significant decreases in complaints from customers of some service providers, including Bell (35% fewer complaints) and Cogeco (almost 69% fewer). We are hopeful that service providers are increasingly seeing the value of developing more robust and effective internal complaint-handling processes, and that more customers are seeing their complaints successfully addressed through interaction directly with their provider.
In 2019, we updated our Strategic Plan around three key pillars, and we are undertaking a variety of activities to address them. Among the most important are the service delivery review (referenced in the Chair’s Message), the restructuring of our organization to ensure that we have experienced and talented staff in all roles, and a renewed focus on adding value for our stakeholders. This focus includes the development of additional public-facing materials, such as more case studies, a regular newsletter, videos explaining our processes, and the forthcoming Annotated Guide to the Procedural Code.
Our work this year—like everyone else’s—was impacted by the COVID-19 pandemic. We are especially proud of our people and how they responded to the pandemic. We closed our offices on March 16 and were able to quickly equip all our staff to work from home, knowing that we would be expected to continue providing our service to Canadians. And our staff stepped up admirably to allow us to meet our objective. To deal with our growth we had leased additional office space and had just begun construction when the pandemic hit. When we are able to get back to our office – whenever that may be – we will have the space we need to accommodate our growing staff.
Our ongoing efforts to provide accessible customer service that accommodates persons with disabilities included consultations with participants from five accessibility groups in 2019-2020. Our new Accessibility Committee also met regularly to discuss the progress of accessibility efforts at the CCTS and it is currently drafting an Accessibility Plan that will be published on our website.
It’s clear from all these initiatives that although complaint numbers are down, we’re still as busy as ever. And our focus on helping consumers and service providers to cooperatively resolve their disputes resulted in almost 90% of complaints being successfully resolved by the parties following our intervention.
As the pandemic has shown us, we can’t predict the future. We can only adapt. And I appreciate our dedicated staff for how well they’ve adapted to working from home, to new initiatives and ongoing organizational changes. Amid all of this, they have worked tirelessly to ensure that the CCTS continues to provide outstanding dispute resolution services for Canadian consumers and service providers. I truly cannot thank you enough.
Howard Maker
Commissioner & CEO, CCTS
Year at a Glance
Annual Report
August 1, 2019 – July 31, 2020
This section provides an overview of significant numbers and events for the CCTS in 2019-20.
By the numbers
Successful resolutions
89% of concluded complaints were successfully resolved.
Complaints down
We experienced a reduction in complaints of 19% compared to last year.
Common issue
Billing problems were the number oneissue for wireless, internet, TV and phone customers.
Performance levels
202 service providers had ZERO complaints. Another 109 had 3 or less.
Industry-wide participation
400 brands operated by 285 service providers are members of the CCTS.
Investigations required
27% of concluded complaints required an investigation.
Total issues
42,913 issues were raised from 15,868 concluded complaints.
Complaints distribution
57% of complaints were filed against 5 service providers.
Key events
Began administrating the new CRTC Internet Code, which applies to Canada’s largest internet providers
Provided input to CRTC Review of Mobile Wireless Services proceeding regarding pricing of low-cost mobile wireless plans
Retained consulting firm cameron.ralph.khoury (CRK) to conduct full review of CCTS operations
Canadian consumer groups elected Catherine Middleton (Professor, Ryerson University, Ted Rogers School of Information Technology Management) and Geneviève Saumier (Professor, McGill University, Faculty of Law) as their representatives on the CCTS Board of Directors; they will assume their roles in October of 2020
Who We Are and What We Do
Annual Report
August 1, 2019 – July 31, 2020
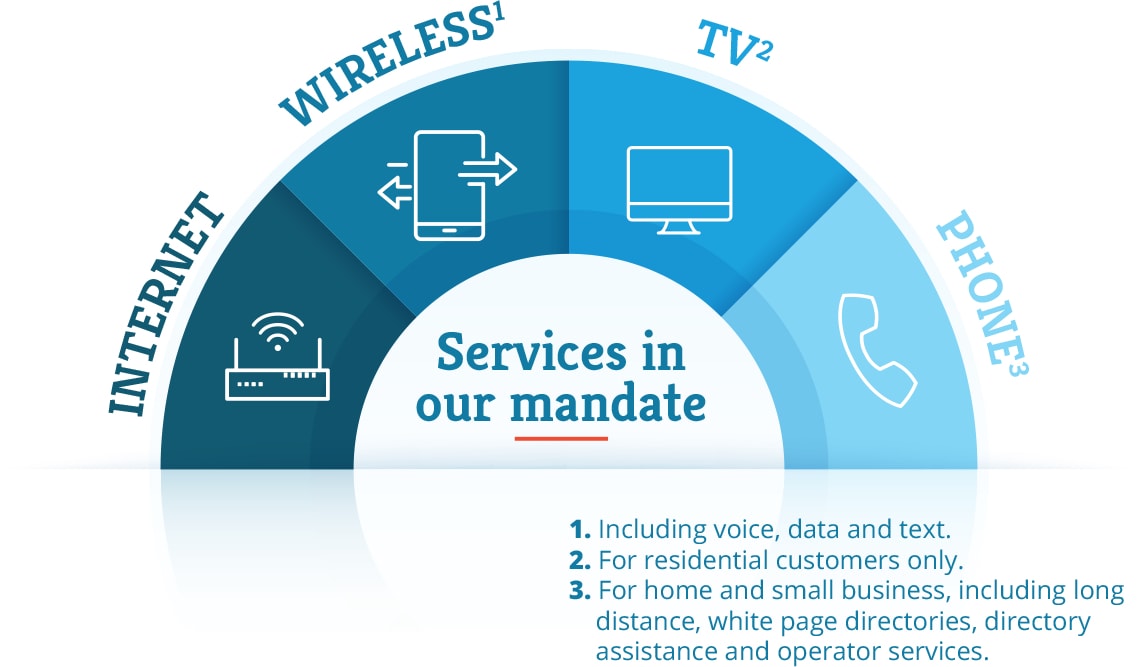
Our mandate
The CCTS is Canada’s national and independent organization dedicated to resolving customer complaints about telecommunications and television services. We work with consumers, small businesses and participating Canadian service providers to resolve disputes about most telecom and subscription TV services after direct communications between a customer and a service provider have proven ineffective.
We can help with most types of problems between a customer and service provider, including disputes about contracts, billing, service delivery and credit management.
This section provides a broad overview of this year’s complaint data. Additional detailed analysis follows throughout the report. For definitions of the terms used in this section, see our Glossary of Terms.
About our data
We report on the complaints that were accepted between August 1, 2019 and July 31, 2020 (our fiscal year) as well as on the complaints that were concluded between those dates.
The complaints we receive and investigate after July 31, 2020 will be reported in next year’s Annual Report.
NOTE: A single complaint may raise more than one issue.
To ensure the accuracy of the statistics we report, we audit the data throughout the year.
Percentages may not add up to 100% due to rounding.
Operational statistics
Table 5.1: Three-year summary of operational statistics
wdt_ID
Measurement
2019-20 number
2019-20 YoY change
2018-19 number
2018-19 YoY change
2017-18 number
2017-18 YoY change
1
Complaints accepted
15,661
-19%
19,287
35%
14,272
57%
2
Complaints concluded*
15,868
-18%
19,371
46%
13,224
53%
3
Complaints resolved
14,120
-20%
17,627
45%
12,149
55%
4
Complaints resolved at pre-investigation
10,911
-20%
13,592
33%
10,214
57%
5
Complaints resolved at investigation
3,209
-20%
4,035
109%
1,935
45%
6
Complaints closed
1,732
0%
1,727
62%
1,068
35%
7
Complaints closed at pre-investigation
676
18%
573
70%
337
13%
8
Complaints closed at investigation
1,056
-8%
1,154
58%
731
48%
9
Recommendations accepted
14
-7%
15
200%
5
67%
10
Decisions issued
2
0%
2
0%
2
100%
* The number of concluded complaints is higher than the number of accepted complaints because some complaints from 2018-19 were also concluded this year.
Table 5.2: Leading complaint issues, broken down by service type
wdt_ID
Service
Billing
Contract dispute
Service delivery
Credit management
Total
1
Wireless
8,309
6,395
3,444
871
19,019
2
Internet
4,212
3,426
3,779
365
11,782
3
TV
2,528
1,844
1,321
195
5,888
4
Local phone
2,146
1,873
1,541
154
5,714
5
Long distance
232
128
142
8
510
6
Directory assistance
0
0
0
0
0
7
White page directories
0
0
0
0
0
8
Total
17,427
13,666
10,227
1,593
42,913
Billing issues decreased by 15% while contract dispute issues decreased by 10%. Service delivery issues decreased marginally by 1% while credit management issues increased by 9%.
The largest number of complaint issues were related to wireless services, including the largest number of issues with billing, contract disputes and service delivery.
Figure 5.1: Complaint issues by service type
Figure 5.2: Main complaint issues
Code of Conduct Reporting
Annual Report
August 1, 2019 – July 31, 2020
When the CCTS investigates customer complaints about telecom and TV services, we try to determine if the service provider has reasonably met its responsibilities to its customer.
We use four mandatory CRTC codes of conduct as yardsticks against which we measure service provider conduct:
Wireless Code: For consumer and small business (mobile) wireless services
Deposit & Disconnection (D&D) Code: For home phone services
Television Service Provider (TVSP) Code: For subscription TV services (residential customers only)
Internet Code: For all retail fixed internet access services (including cable, fibre, digital subscriber line [DSL], fixed wireless and satellite services) and internet services provided by Canada’s ten largest internet service providers. (Mobile wireless internet services are covered by the Wireless Code.)
To learn about how we administer the CRTC codes of conduct, watch the video below.
For more detailed information about the preceding codes, see:
“My 2-3 year ordeal of trying to resolve over-billing with the service provider was corrected in less than a week. Thank you CCTS.”
Resolving complaints and analyzing code compliance
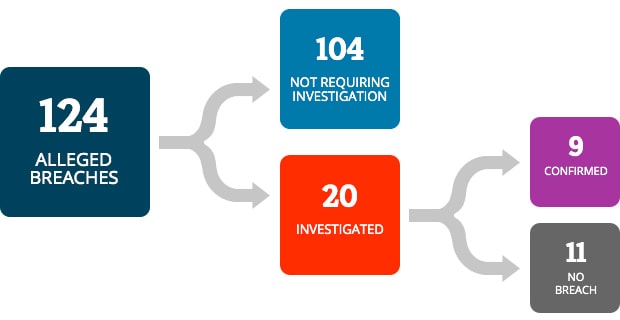
When we accept a customer complaint we record and track all of the issues raised in the complaint. Some complaints raise questions about whether a service provider has complied with a code of conduct. We call these “alleged breaches.”
The vast majority of complaints are resolved to the satisfaction of the customer and the service provider at an early stage of our process. When complaints are resolved, there is no need for us to investigate the underlying issues, including to determine if there have been any violations of a code of conduct. Therefore, these issues remain characterized as “alleged breaches.”
In the cases that we do investigate, we can determine whether there has been a violation. We categorize proven violations as “confirmed breaches.” When we investigate and determine that there has not been a violation, we categorize this as “no breach.”
In this section, we present statistical reports on breaches of the four applicable codes using the preceding terminology.
Wireless Code
The Wireless Code seeks to ensure that consumers of voice and data services are better informed of the rights and obligations contained in their contracts. The Wireless Code applies to individual and small business consumers, and all wireless service providers must follow its guidelines.
Figure 6.1: Summary of Wireless Code breaches
Table 6.1: Wireless Code confirmed breaches by section
wdt_ID
Code section
# of confirmed breaches
% of total confirmed breaches
YoY change
1
A. Clarity
1
0.5%
-75.0%
2
A.1. Plain language
1
0.5%
-66.7%
3
A.2. Prices
0
0.0%
–
4
A.3. Unlimited services
0
0.0%
-100.0%
5
B. Contracts and related documents
67
36.4%
28.8%
6
B.1.(i-ii) Permanent copy of the contract and related documents
14
7.6%
-39.1%
7
B.1.(iii) a-e Key contract terms and conditions
53
28.8%
112.0%
8
B.1.(iii) f-m Other aspects of the contract
0
0.0%
-100.0%
9
B.2. Prepaid service contracts
0
0.0%
-100%
10
C. Critical Information Summary
53
28.8%
278.6%
There were 184 confirmed breaches of the Wireless Code, an increase of 16.5% over last year.
Section B (contracts and related documents) was the most breached section (over 36% of all Wireless Code confirmed breaches), an increase of almost 29% over last year. We found that, in 14 cases, a permanent copy of the contract was not provided to the customer: this is a contravention of the requirements of the Wireless Code.
The second most-breached section was Section C (Critical Information Summary), with almost 29% of Wireless Code confirmed breaches—a 278% increase over last year.
Section E (bill management) accounted for only 6.5% of all Wireless Code confirmed breaches, a 50% decrease from last year. This is the second year of sizable decreases. Last year, Section E accounted for 15% of all Wireless Code confirmed breaches, a 41% decrease from the preceding year.
Table 6.2: Wireless Code confirmed breaches by service provider
wdt_ID
Breach
Koodo
Bell
Rogers
TELUS
Fido
Videotron
Virgin
Simply Connect
Freedom Mobile
Total
1
# of confirmed breaches
101
27
17
15
13
4
4
2
1
184
2
% of all confirmed breaches
54.9%
14.7%
9.2%
8.2%
7.1%
2.2%
2.2%
1.1%
0.5%
100%
3
YoY change
100.0%
-41.3%
-45.2%
-51.6%
8.3%
0.0%
-50.0%
100.0%
-96.0%
16.5%
4
Section A. Clarity
0
0
0
0
1
0
0
0
0
1
5
Section B. Contracts and related documents
49
5
5
7
1
0
0
0
0
67
6
Section C. Critical Information Summary
44
5
2
0
2
0
0
0
0
53
7
Section D. Changes to contracts and related documents
0
6
1
0
1
0
0
0
0
8
8
Section E. Bill Management
7
2
1
0
2
0
0
0
0
12
9
Section F. Mobile device issues
0
1
0
0
0
0
0
0
0
1
10
Section G. Contract cancellation and extension
0
2
1
1
1
0
1
0
0
6
Koodo had no breaches of the Wireless Code last year but 101 breaches this year, accounting for almost 55% of all confirmed breaches. Bell had 27 breaches of the Wireless Code (close to 15%), a 41% decrease from last year. Rogers had 17 breaches (9%), a 45% decrease from last year.
Freedom Mobile had 25 breaches last year but only one breach this year, a decrease of 96%.
Deposit and Disconnection Code
The D&D Code provides local phone customers with protection in some cases when they’re required to provide a deposit as a condition of obtaining local phone service or when a service provider intends to disconnect the customer’s local phone service.
Confirmed breaches of the D&D Code have declined through the years, with six breaches two years ago and no breaches last year. However, this year there were nine breaches of the D&D Code. Seven of these breaches were to Section 3.2 (notice at least 14 days prior to disconnection).
Figure 6.2: Summary of D&D Code breaches
Figure 6.3: Summary of TVSP Code breaches
Television Service Provider Code
The Television Service Provider Code (TVSP Code) is intended to make it easier for Canadians to understand their television service agreements and to empower residential customers in their relationships with TVSPs.
The TVSP Code applies only to consumers (not small businesses), and all licensed TV service providers must follow its guidelines. We address complaints about subscription TV services provided by cable, Internet Protocol television (IPTV) and national satellite direct-to-home (DTH) TV service providers.
There were seven confirmed breaches of the TVSP Code this year, up from three last year.
Table 6.3: TVSP Code confirmed breaches by service provider
wdt_ID
Breach
Bell
Rogers
TELUS
Total
1
# of confirmed breaches
5
1
1
7
2
% of all confirmed breaches
71.4%
14.3%
14.3%
100%
3
YoY change
150.0%
100.0%
100.0%
133%
4
Section VII. Agreements and related documents
2
0
1
3
5
Section IX. Critical Information Summary
0
1
0
1
6
Section XI. Changes to programming options
3
0
0
3
Internet Code
The Internet Code was created so that customers of fixed internet access services are better informed of their rights and responsibilities contained in their contracts with internet service providers (ISPs). As explained in the CRTC’s detailed Regulatory Policy, the goal of the Code is to make it easier for individual customers to understand their internet service contracts, to prevent bill shock from overage fees and price increases, and to make it easier for Canadians to switch internet service providers.
The Internet Code applies only to individual customers; it does not apply to small business customers.
The CRTC published the Internet Code in July of 2019 and the CCTS began to administer it when it took effect on January 31, 2020.
The Code applies to the following service providers:
Bell Canada (including Bell MTS, NorthernTel and Télébec)
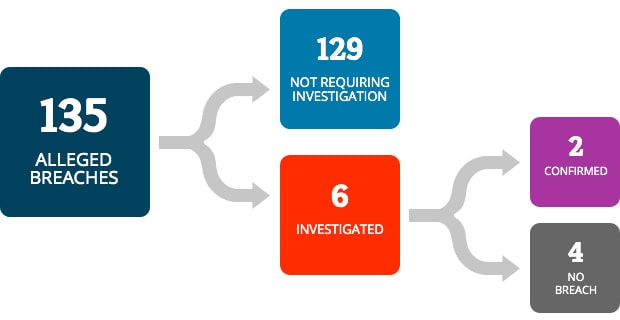
In the six months since the CCTS began administering the Internet Code, there were only two confirmed breaches: one by Bell (Section A. Clarity) and one by Virgin Mobile, which is a Bell company (Section G. Contract cancelation and extension).
In the same six-month period, there were 135 alleged breaches of the Internet Code. Section A (clarity) accounted for the highest proportion (27%), followed by Section D (changes to contracts and related documents), which accounted for 24%. Section I (disconnection), Section B (contracts and related documents) and Section G (contract cancellation and extension) accounted for 17%, 15% and 11%, respectively.
Figure 6.4: Summary of Internet Code breaches
Topics and Trends
Annual Report
August 1, 2019 – July 31, 2020
Overview
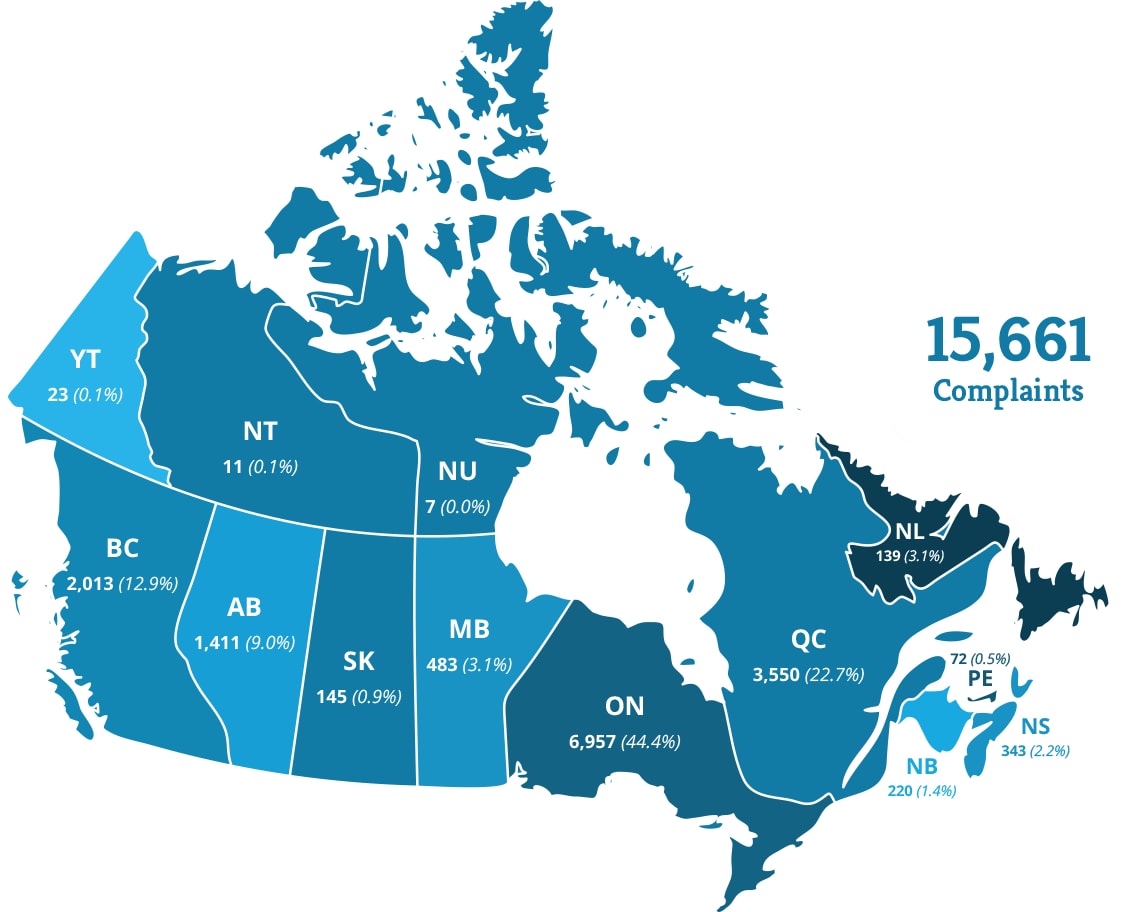
In 2019-20, Canadians filed 15,661 complaints about their service providers, down 19% from last year and the first decrease since 2015-16. It’s good news when fewer customer complaints escalate to the CCTS. It’s also good news that we have successfully resolved almost 90% of these complaints.
These complaints raised almost 43,000 issues that fell within the CCTS mandate, a decrease of 9.5% from last year. Wireless issues continue to be raised the most often, representing 44% of all issues raised. Internet issues continue to be in second place, accounting for 27.5% of issues.
Table 7.1: Number of issues by service type, YoY change
wdt_ID
Service
# of issues in 2019-20
% of all issues in 2019-20
# of issues in 2018-19
YoY change in # of issues raised
1
Wireless
19,019
44%
19,467
-2%
2
Internet
11,782
27%
12,083
-2%
3
TV
5,888
14%
7,749
-24%
4
Local phone
5,714
13%
6,938
-18%
5
Other
510
1%
1,189
-57%
6
Total
42,913
100%
47,426
-10%
Figure 7.1: Five-year view of issues by service type
NOTE: TV complaints were not in the CCTS mandate until September 1, 2017.
“Because of the CCTS, my 1.5-year issue was resolved in a day.”
Spotlight on wireless
Wireless continues to be the service most complained about
Wireless issues account for 44% of all issues, up from 41% last year
Wireless customers raise more disclosure issues (15% of all wireless issues) than any other issues
Disclosure issues among wireless customers are up by 12% despite an overall reduction in issues this year
Incorrect charge is the number two issue, up 3% from last year and accounting for 11% of all wireless issues
Figure 7.2: Five-year view of wireless issues
Table 7.2: Top 10 wireless issues
Issue
Number
Proportion
YoY (%)
Disclosure issues
2,924
15%
12%
Incorrect charge
2,156
11%
3%
Breach of contract
1,278
7%
-9%
Intermittent/inadequate quality of service
1,194
6%
-3%
Data charges
1,057
6%
-22%
Credit/refund not received
1,048
6%
6%
Credit reporting
769
4%
24%
Material contract change without notice
529
3%
-21%
Complete loss of service
401
2%
-18%
Non-payment/collections
392
2%
3%
Figure 7.3: Five-year view of internet issues
Spotlight on internet
Internet issues account for 27.5% of all issues raised, up from 25% last year
Intermittent/inadequate quality of service is the leading internet issue, accounting for 14% of all internet issues
Intermittent/inadequate quality of service issues among internet customers are up by 12% despite an overall reduction in issues this year
Incorrect charge and disclosure issues are tied for the second most-complained about issue, each accounting for 13% of all internet issues
Although incorrect charge issues are down 23% from last year, disclosure issues are up by 17%
Table 7.3: Top 10 internet issues
Issue
Number
Proportion
YoY (%)
Intermittent/inadequate quality of service
1,707
14%
12%
Incorrect charge
1,506
13%
-23%
Disclosure issues
1,504
13%
17%
Credit/refund not received
589
5%
-22%
Breach of contract
552
5%
9%
Regular price increase of monthly price plans
505
4%
60%
Legitimacy of early termination fee (ETF)
440
4%
-4%
Complete loss of service
417
4%
-5%
Customer cancellation due date not kept/delayed
352
3%
48%
Credit reporting
331
3%
6%
Spotlight on TV
TV issues account for 14% of all issues, down from 16% last year
Incorrect charge issues are down 37% from last year but are still the leading issue, accounting for 16% of all TV issues
Disclosure issues are up 4% from last year and also account for 16% of all TV issues
Intermittent/inadequate quality of service is in third place, down 19% from last year and accounting for 7% of TV issues
Figure 7.4: TV issues, year-over-year view
Table 7.4: Top 10 TV issues
Issue
Number
Proportion
YoY (%)
Incorrect charge
943
16%
-37%
Disclosure issues
914
16%
4%
Intermittent/inadequate quality of service
386
7%
-19%
Regular price increase of monthly price plans
333
6%
53%
Credit/refund not received
320
5%
-37%
Breach of contract
277
5%
-30%
Customer cancellation due date not kept/delayed
205
3%
31%
Final bill charges after cancellation
194
3%
-47%
Material contract change without notice
186
3%
-24%
Credit reporting
183
3%
-11%
Figure 7.5: Five-year view of phone issues
Spotlight on phone
Local phone service (landlines) accounts for 13% of all issues, down from 15% last year
Incorrect charge is the most-complained-about phone issue, accounting for 14% of all phone issues; however this issue is down by 34% from last year
Disclosure issues are in second place, accounting for 12% of all phone issues
Table 7.5: Top 10 phone issues
Issue
Number
Proportion
YoY (%)
Incorrect charge
818
14%
-34%
Disclosure issues
686
12%
-2%
Intermittent/inadequate quality of service
320
6%
-15%
Legitimacy of ETF
299
5%
-3%
Regular price increase of monthly price plans
271
5%
61%
Breach of contract
254
4%
-6%
Credit/refund not received
254
4%
-32%
Complete loss of service
238
4%
-32%
Unable to port
215
4%
-16%
Final bill charges after cancellation
181
3%
-53%
Breakdown of issues across all service types
Disclosure issues continue to be the top issues raised by all customers, followed by complaints about the incorrect billing of their monthly price plans.
Table 7.6: Top 10 issues across all service types
wdt_ID
Issue
Number
Proportion
YoY change
Wireless
Internet
TV
Phone
1
Disclosure issues
6,066
14%
10%
48%
25%
15%
11%
2
Monthly price plan - Incorrect charge
5,543
13%
-20%
39%
27%
17%
15%
3
Intermittent/inadequate quality of service
3,626
8%
0%
33%
47%
11%
9%
4
Breach of contract
2,367
6%
-8%
54%
23%
12%
11%
5
Credit/refund not received
2,223
5%
-16%
47%
26%
14%
11%
6
Credit reporting
1,428
3%
8%
54%
23%
13%
10%
7
Regular price increase of monthly price plans
1,417
3%
-3%
21%
36%
24%
19%
8
Legitimacy of ETF
1,293
3%
-3%
30%
34%
12%
23%
9
Complete loss of service
1,218
3%
-22%
33%
34%
12%
20%
10
Material contract change without notice
1,111
3%
-25%
48%
23%
17%
12%
“I got nowhere battling with my service provider for 5 months. The CCTS resolved 100% of my issue in 15% of that time with 5% of the effort and 1% of the headaches.”
Disclosure issues
Customers often have concerns about information not being fully or clearly provided. Disclosure is the leading issue raised this year (over 6,000 times), up 10% from last year and accounting for 14% of all issues raised across all types of service. Over the last five years, disclosure issues have increased by 221%.
Figure 7.6:Five-year view of disclosure issues
Disclosure is the number one issue raised by wireless customers and is either the number two or number three issue for internet, TV and phone customers.
Figure 7.7: Disclosure issues by type of service
Disclosure issues are raised disproportionately by wireless customers. Although wireless customers account for 44% of all issues raised, they account for almost half of the disclosure issues. Many of the disclosure issues could have been avoided by ensuring that clear, concise and accurate information was provided to customers when they agreed to sign up for service.
Bell accounts for 37% of all disclosure issues. Although this is down from 41% the previous year, it is more than we would expect considering that Bell only accounts for 31% of overall issues.
Both Rogers and Videotron customers report significant increases in disclosure issues from last year: 39% and 54% respectively.
Lucky Mobile, ACN Canada, Distributel and Comwave also experienced increases in the number of times this issue was raised by their customers while Fizz, Acanac, Cogeco, Primus, Xplornet, Public Mobile and Bell Aliant showed improvement, with modest decreases in the number of times this issue was raised by their customers.
Table 7.7: Disclosure issues – Top 10 service providers
wdt_ID
Service provider
2019-20
YoY change
Proportion of disclosure issues
Proportion of all issues
Resolution rate
1
Bell
2,259
4%
37%
31%
88%
2
Rogers
760
39%
13%
12%
88%
3
Videotron
439
54%
7%
5%
96%
4
TELUS
407
0%
7%
7%
90%
5
Fido
383
45%
6%
5%
91%
6
Freedom Mobile
335
16%
6%
5%
95%
7
Virgin Mobile
311
-6%
5%
5%
94%
8
Shaw
270
15%
5%
5%
95%
9
Koodo
173
0%
3%
3%
88%
10
Cogeco
129
-45%
2%
3%
98%
The top type of disclosure issue concerns a conflict/mismatch between what a customer has agreed to purchase and what their agreement, which is often sent to them after the transaction, indicates. This type of disclosure issue accounts for almost 70% of all disclosure issues. The second most-raised disclosure issue is a lack of full disclosure about promotions, which accounts for 18% of all disclosure issues.
There’s a significant decrease in the number of times customers complained about material contract changes both with and without notice (with notice is down by 66%; without notice is down by 25%). However, this issue was still raised over 1,800 times and remains a source of consumer frustration, especially for wireless customers, which account for 48% of this issue.
Table 7.8: Types of disclosure issues, broken down by service type
wdt_ID
Issue
Wireless
Internet
TV
Phone
Long distance
Total
Proportion of all disclosure issues
1
Contract conflicts with agreement
2,036
1,049
600
479
25
4,189
69%
2
Details of promotion not fully disclosed
525
252
178
104
9
1,068
18%
3
Service provider’s right to make unilateral changes
167
137
106
79
2
491
8%
4
Plan eligibility requirements not properly disclosed
122
55
24
20
2
223
4%
5
Changes requested during trial period not implemented
74
11
6
4
0
95
2%
6
Total
2,924
1,504
914
686
38
6,066
Contract conflicts with agreement
Of all disclosure issues raised, 69% are the result of a conflict/mismatch between what the customer agreed to purchase (often orally) and what is indicated in their contract, which is sent to them after the transaction occurred. This type of disclosure issue was raised 4,189 times this year. Almost half were raised by wireless customers and 25% by internet customers. Of the 4,189 times this issue was raised, 85% was after a customer had entered into an agreement at a distance.
The top three service providers with this type of disclosure issue are Bell (36%), Rogers (12%) and Videotron (9%).
Table 7.9: Disclosure – Contract conflicts with agreement: Top 3 service providers
Service provider
Number of times issue was raised
Proportion of issue
Bell
1,492
36%
Rogers
500
12%
Videotron
358
9%
Case Summary
Failure to provide contract or critical information summary
A wireless customer told us that he had agreed to keep his business wireless service with his current service provider because the provider had agreed to match a competitor’s offer. The customer renewed his 24-month agreement and was to be billed $263 per month. However, the customer was billed almost double what he claimed was the agreed-upon price. After trying unsuccessfully to resolve the matter with his provider, he contacted the CCTS.
During our investigation, the provider could not demonstrate what price was offered and agreed upon by the customer. It therefore agreed to apply a credit to the customer’s account reflecting the difference between what he was expecting to be billed based on his oral agreement with his provider, and what he had actually been billed. In addition, the provider applied a lump-sum credit of $150 and removed late-payment fees associated with the customer’s account. The provider also applied a further 15% reduction in price for the remaining months of the two-year agreement. The customer was satisfied with this offer and accepted it, resolving the complaint.
Case Summary
Promised discount not provided
A customer told the CCTS she had agreed to receive home phone, internet and TV services from her provider for a total of $177 per month but was instead charged $227 per month: $50 more each month than the agreed-upon price. She was unable to resolve the matter with her provider, and she submitted a complaint to the CCTS.
We asked the provider to submit documentation to help us in our investigation, including a copy of the recorded phone call with the customer. After listening to this call, we determined that the regular price for the customer’s services was indeed $227 per month but that the agent had offered to provide the services for $177 per month, just as the customer had told us. After we spoke with the provider, it applied a credit to the customer’s account for the difference between what the customer should have been billed and what she was actually billed during the four months the issue persisted. In addition, the provider offered to lower her price to $169 per month for the next 12 months. The customer was satisfied, and the complaint was resolved.
Key Message
Service providers must provide clear and accurate information to customers and are expected to honour the commitments made by their employees. The Wireless Code requires that both a contract and a critical information summary be provided to customers so they have a clear understanding of their service agreement. To avoid subsequent disputes we recommend that customers make use of electronic communications such as email and webchat whenever possible and that they keep a record of their communications.
Case Summary
Information missing from contract and critical information summary
A wireless customer contacted his service provider after being charged over $150 for long distance calls to the United States. He later told the CCTS that he was advised when signing up for service that free international long distance calls were included because he had added international calling to his service. When his provider refused to credit the charges, stating that calls to the United States were not included in the add-on, the customer contacted the CCTS.
During our investigation we found that the details about the limits to the customer’s international calling add-on were included on his invoice but had not been included in his contract. Instead, the contract simply listed the name of the international long distance add-on without any mention of limits to this plan that could result in the customer incurring overage charges; this is contrary to the requirements in section B1(iii)(a) of the Wireless Code. We also examined the critical information summary (CIS) provided to the customer and found that the provider also breached section C1(iii)(a) of the Wireless Code because the CIS did not disclose the information required. In light of this, the provider agreed to credit the customer’s account for the long distance charges and provided an additional $20 credit, which satisfied the customer.
This year, the CCTS confirmed 53 breaches of each of the two sections of the Wireless Code in the preceding case summary, a year-over-year increase of 112%. Together, these two sections account for over 57% of all Wireless Code breaches.
Key Message
The Wireless Code requires providers to disclose the services included in the contract, including any limits to those services that may result in additional fees, both in the contract and in the critical information summary. These are fundamental requirements to ensure that customers are aware of what they are getting when they sign up for service. We strongly recommend that providers review their practices, contracts and critical information summaries to ensure that they are compliant with the Wireless Code, so that these types of complaints do not persist.
Lack of disclosure about promotions
Disclosure issues are also being raised as a result of a lack of information related specifically to promotions, which account for 18% of all disclosure issues (1,069 issues).
Bell accounts for a disproportionate percentage of these issues. Although it accounts for 31% of all issues raised, it accounts for 40% of disclosure issues specifically relating to the terms associated with promotions.
Table 7.10: Disclosure – Promotion details: Top 3 service providers
Service provider
Number of times issue was raised
Proportion of issue
Bell
432
40%
Rogers
151
14%
TELUS
80
7%
Case Summary
Customer unaware of terms of service
A customer had agreed to obtain four wireless lines with his service provider. Two of the lines had initially been activated in 2014, one in 2017 and one in 2019. The customer told the CCTS that for each of these services he was offered a discount of $5 per month and that this formed part of his agreement with his provider. The customer received the discount of $5 per line per month, for a total of $20 per month, until early 2020, when the provider removed this discount. When he could not resolve the matter directly with his provider, he filed a complaint with the CCTS.
During our investigation, we asked the provider to submit documentation to help determine the rates that the customer was offered, the terms associated with the discount and the amounts the customer had been billed. We reviewed each of the customer’s four wireless contracts and did not find any mention of the $5 per-line, per-month discount. We therefore concluded that this did not form part of the customer’s contract with the provider.
We also reviewed the provider’s terms of service and found that these permitted it to change the price of a customer’s service upon thirty days’ notice. In reviewing the customer’s invoices, we found that the provider had informed the customer as required that the $5 per month discount would be discontinued the following month. As a result, we concluded that the provider had the authority to remove the discount because it had given the customer the required notice.
To resolve the complaint, the provider nonetheless offered to apply a $3 per month discount on each of the customer’s four lines for a 12-month period as well as to provide him with additional data free of charge. The customer was satisfied with the outcome, and the complaint was resolved.
Case Summary
Customer unclear about details of promotion
A customer contacted the CCTS after her attempts to resolve a dispute with her provider were unsuccessful. The customer told us that her provider had overcharged her for her TV and internet services. She said that she was supposed to be paying $107 per month and had been remitting this amount but had just discovered that the provider was billing her more.
During our investigation, we found that the customer had been provided with a promotional discount of $31 off her monthly service charges but that this promotion was valid for only the first 12 months of her 24-month service agreement. Her provider submitted documentation to us to demonstrate that it had disclosed the nature of the promotional discount and that the promotion would expire. Nonetheless, the provider offered to credit 50% of the additional charges that had accumulated over the course of the contract, for a total credit of $236. The customer was happy with the outcome, and the matter was resolved.
Key Message
Unless something is stated in the contract, it falls under the general terms of service, which often allow providers to remove or change items with notice. Given that lack of disclosure about promotions is an issue raised over 1,000 times this year, providers should carefully review their practices to ensure that their employees are properly informing customers about the terms of service associated with promotions. Customers should carefully review their contracts to ensure that any promises are captured there and that they fully understand any limits associated with promotions they are offered.
Billing issues
Although billing issues are down 15% year-over-year, they were raised 17,427 times about telecom and TV services, more than any other main category of issue (billing, contract dispute, service delivery, credit management). Over the last five years, billing issues have increased by 169%.
Figure 7.8: Five-year view of billing issues
Forty-eight percent of all billing issues are related to wireless services, a somewhat higher proportion than what we could expect considering that wireless accounts for 44% of issues raised overall.
Table 7.11: Billing issues by service type
Service
Number
Proportion
Wireless
8,365
48%
Internet
4,182
24%
TV
2,614
15%
Phone
2,091
12%
Long distance
174
1%
Bell accounts for 5,717 of the billing issues that were raised, down 25% compared to last year. Rogers customers raised 2,062 of the billing issues, up 11% from last year. TELUS was the third-leading service provider for billing issues, with 1,235, down 17% over last year.
Table 7.12: Billing issues – Top 10 service providers
wdt_ID
Service provider
2019-20
YoY change
Proportion of billing issues
Proportion of all issues
Resolution rate
1
Bell
5,717
-25%
33%
31%
86%
2
Rogers
2,062
11%
12%
12%
85%
3
TELUS
1,235
-17%
7%
7%
88%
4
Fido
1,135
34%
7%
5%
86%
5
Virgin Mobile
1,067
-6%
6%
5%
91%
6
Videotron
1,055
3%
6%
5%
91%
7
Freedom Mobile
767
-3%
4%
5%
95%
8
Koodo
690
15%
4%
3%
89%
9
Shaw
654
-13%
4%
5%
88%
10
Cogeco
371
-79%
2%
3%
92%
NOTE: The average resolution rate for all complaints across all service types is 89%.
The top billing issues are incorrect charges relating to monthly price plans, followed by credit/refund not received and increases to monthly charges.
It’s notable that the number of times customers complained about being charged for services after having cancelled service is down by 41% from last year (although this issue was still raised over 1,000 times).
Table 7.13: Top 10 billing issues
Issue
Number
Incorrect charge
5,543
Credit/refund not received
2,223
Regular price increase of monthly price plans
1,417
Data charges
1,057
Final bill charges after cancellation
1,006
Equipment charges
785
Invoices not received
639
Late-payment fees
492
Activation/reactivation charges
474
Misapplied payments
403
Incorrect charge relating to monthly price plan
Thirty-two percent of all billing issues are from customers who complain about being charged incorrectly for their monthly price plans. Although the number of times this issue was raised is down 20% from last year, it was raised 5,500 times in 2019-20, making it the number one issue under the billing category and the second most-complained-about issue overall, accounting for 13% of all issues raised across all types of service.
Although this issue is raised most often by wireless customers, it is the leading issue for both TV customers and phone customers. Both TV and phone customers raise this issue disproportionately given their share of the overall issues raised.
Table 7.14: Incorrect charge to monthly price plan by service type
Service
Number
Proportion
Wireless
2,156
39%
Internet
1,506
27%
TV
943
17%
Phone
818
15%
We are unable to determine why TV and phone customers raise this issue disproportionately while the proportion of this issue raised by internet and wireless customers is as expected or lower than expected given their share of the overall proportion of complaints. We do note that the internet and Wireless Codes of Conduct are more rigid in terms of disclosure requirements and changes to monthly prices when compared to the TVSP Code, which may help explain this result. We urge service providers to review their practices in this regard because there is an opportunity to reduce the number of complaints about incorrect charges relating to their monthly service from TV and phone customers specifically and from all customers generally.
The top three service providers with billing issues related to incorrect charges to monthly price plans are Bell (36%), Rogers (13%) and Videotron (8%).
Fido customers account for only 6% of this issue and therefore do not form part of the top three providers for this issue, but it’s notable that the number of times they raised this issue is up 43% from last year.
Table 7.15: Incorrect charge to monthly price plan by service type – Top 3 service providers
Service provider
Number of times issue was raised
Proportion of issue
Bell
2,001
36%
Rogers
697
13%
Videotron
434
8%
Case Summary
Incorrect charge for services
A customer contacted the CCTS because he claimed he was being billed incorrectly for his local phone service. He was billed almost $37 per month but claimed his monthly service fees should have been $29 per month.
The customer’s provider failed to respond to the CCTS complaint, so it was escalated for investigation. During our investigation, we were able to discuss the matter with the provider, which agreed to credit the customer for the amount it had overbilled him during the months in question. The customer was satisfied with the outcome, and the complaint was resolved.
Case Summary
Failure to fix billing error
The CCTS received a complaint from a wireless customer. She claimed that her service provider was charging her incorrectly for her service and she could not resolve her complaint directly with her provider. The customer told us that she was supposed to be billed $55 per month for her service but was being charged $65 per month. The provider informed her that the difference would be credited to her account the following month and that the correct rate would be applied going forward; however, these things were never done.
After we accepted the complaint, we sent it to the provider and asked the provider to resolve this billing error. The provider immediately issued a credit of $33.90 to the customer, an amount equal to what she had been overbilled, and confirmed that the matter was corrected going forward. This result satisfied the customer, and the complaint was resolved.
Credit/refund not received
This year, customers raised concerns about not receiving a promised credit or refund 2,223 times. Although this represents a decrease of 16% from last year, it is still the second-leading billing-related issue raised by customers.
Table 7.16: Credit/refund not received issues by service type
Service type
Number
Proportion
Wireless
1,048
47%
Internet
589
26%
TV
320
14%
Phone
254
11%
Long distance
12
1%
The top three providers for this issue are Bell (31%), Rogers (10%) and Videotron (10%). Although Bell customers raised this issue most often, we note that they raised it 20% less than last year. Videotron accounts for a disproportionate number of these issues: 10% of credit/refund not received issues compared to 5% of issues overall. We also note that Videotron customers have raised this issue 51% more often than last year.
Table 7.17: Credit/refund not received – Top 3 service providers
Service provider
Number of times issue was raised
Proportion of issue
Bell
693
31%
Rogers
231
10%
Videotron
220
10%
Case Summary
Provider slow to refund credit balance
The CCTS received a complaint from the mother of a wireless customer. The mother advised us that her son, who suffers from cognitive impairment, had been overpaying his wireless account for approximately the last year, and that the account now had a credit balance of over $14,000. She needed help because the service provider refused to refund the balance to her son.
The provider informed us that it was unable to refund payments made online and the customer would need to contact her son’s financial institution. The mother told us she had already contacted the bank and was informed there was nothing they could do; the provider would need to refund the credit balance. We discussed this matter with the service provider, which eventually agreed to refund the customer the credit balance of over $14,000 by issuing him a cheque; this resolved the complaint.
Case Summary
Failure to provide refund
An internet customer had signed up for service, having pre-paid his monthly service fees for one year, totalling almost $600. However, the next day, the customer changed his mind about obtaining his service from this particular provider and cancelled his service request prior to it being activated. The customer submitted a complaint to CCTS when his provider did not refund him the $600 he had paid.
During the course of our investigation, we were able to confirm that the customer had indeed remitted the payment he claimed. The provider failed to respond to our requests for information and to discuss this matter. We therefore issued a Recommendation requiring the provider to refund the customer his $600 and to provide him with an additional $100 for the inconvenience he suffered. Both the customer and provider accepted the Recommendation, and the complaint was concluded.
Increases to monthly charges
Complaints about increases to monthly charges were the number three billing issue and were raised over 1,400 times this year. Although this is a 3% overall decline year-over-year, the number of times this issue is being raised is up 61% for phone customers, 60% for internet customers and 53% for TV customers.
Internet customers raised this issue the most often, accounting for 36% of this issue, followed by TV customers at 24%.
Table 7.18: Credit/refund not received issues by service type
Service type
Number
Proportion
Internet
505
36%
TV
333
24%
Wireless
304
21%
Phone
271
19%
Long distance
4
0%
The top three providers for this issue were Bell (49%), Rogers (13%) and Videotron (6%). Bell accounts for a disproportionate number of these issues–49%–when we consider that it only accounts for 31% of issues overall. The number of times Rogers’ customers raised this issue is down slightly (-1%) whereas Videotron customers raised this issue 16% more often than last year.
Table 7.19: Increases to monthly charges – Top 3 service providers
Service provider
Number of times issue was raised
Proportion of issue
Bell
691
49%
Rogers
188
13%
Videotron
86
6%
Case Summary
Customer confused about monthly charges
A TV and internet customer claimed that the monthly price of her services increased significantly, from $120 per month to $150, without prior notice and without any enhancements to her services. When she was unable to resolve her dispute with her service provider, she submitted a complaint to the CCTS.
During our investigation, we reviewed the terms of service associated with the customer’s service. We found that those terms gave the provider to right to increase the price of its services provided that at least 30 days’ written notice was given to the customer. The provider informed us that it did not apply a price increase of $30 per month as alleged by the customer but rather that the price had increased by $2.50. The provider submitted invoices to the CCTS on which we found that the customer had been provided with 60 days’ notice that the price of her TV services would be increasing by $2.50 per month. Further review of invoices confirmed that the price increase was applied for the amount and on the date indicated in the notice.
We explained to the customer that the terms of service allowed the provider to increase the monthly price for her TV services, subject to 30 days’ written notice. We further explained that such notice was provided to her 60 days prior to the price increase taking effect. Although the customer was not happy with the price increase, she understood why it had transpired, and the complaint was closed.
Case Summary
Mismatch between customer expectations and monthly charges
A customer informed us that he had left his wireless service provider for a new provider that offered him similar service for less money. The customer said he had asked the new provider whether this was a promotional price and was advised that the price would not increase. However, the provider began charging the customer $5 more per month after the customer agreed to receive the service. When the customer could not resolve the matter with his provider, he submitted a complaint to the CCTS.
During our investigation, we found that the customer’s wireless services were not subject to a fixed-term contract but were instead being provided on a month-to-month basis. In reviewing the provider’s terms of service, we found that it had the right to increase the customer’s price upon 30 days’ notice. We also reviewed the customer’s invoices and saw that the provider informed him of the price increase 60 days before it took effect.
We informed the customer of our finding that the provider had followed its terms of service in increasing his monthly price and that he was not subject to a fixed-term agreement to keep his services. The customer thanked us for the information, and the complaint was concluded.
Key Message
In general, the prices charged by service providers in Canada are not regulated by the CRTC. As a result, service providers are free to set their own prices and also adjust them. Whether a provider can increase its prices depends on the type of service, the nature of the commitment (either a fixed-term contract or an indeterminate month-to-month contract), what the terms of service and contract say about prices and, for wireless, internet and TV services, the rules of the relevant code of conduct.
We urge customers to ask providers—at the time of service signup—if the terms of service allow for price increases to service charges. After signup, customers who have concerns about increases to prices should carefully review their terms of service and contract as well as the Wireless Code, Internet Code or TVSP Code if applicable. When in doubt, they should contact their provider for clarification.
We encourage service providers to strive for clarity during service signup, to also ensure that pricing is clear in contracts and terms of service, and to work with customers to resolve billing disputes.
Service delivery issues
Customers raised concerns about service delivery 10,227 times last year, a 1% decrease over the previous year. These issues make up an increasing proportion of the issues raised, accounting for 24% of all issues raised by customers, up from 22% last year. Over the last five years, service delivery issues have increased 184%.
Figure 7.9: Five-year view of service delivery issues
Internet customers raised concerns about service delivery the most often (37%), a disproportionately high percentage considering that, overall, internet customers make up 27.5% of all issues raised.
Table 7.20: Service delivery issues by service type
Service type
Number
Proportion
Internet
3,784
37%
Wireless
3,477
34%
Phone
1,534
15%
TV
1,330
13%
Long distance
102
1%
Bell accounts for 25% of the service delivery issues raised, a somewhat low proportion considering its proportion of all issues raised (31%). Although Rogers’ share of this issue is only 12%, its customers raised this issue 62% more often than they did last year while Shaw’s customers raised service delivery issues 68% more often. Last year, we reported a significant increase in the number of times Cogeco customers reported service delivery issues. We are pleased to see a 71% reduction in service delivery issues reported by Cogeco customers this year.
Table 7.21: Service delivery issues – Top 10 service providers
wdt_ID
Service provider
2019-20
YoY change
Proportion of service delivery issues
Proportion of all issues
Resolution rate
1
Bell
2,508
-13%
25%
31%
87%
2
Rogers
1,215
62%
12%
12%
83%
3
TELUS
739
22%
7%
7%
89%
4
Shaw
704
68%
7%
5%
89%
5
Freedom Mobile
639
13%
6%
5%
93%
6
Cogeco
385
-71%
4%
3%
93%
7
Virgin Mobile
379
0%
4%
5%
87%
8
Xplornet
355
17%
3%
1%
89%
9
Fido
318
37%
3%
5%
77%
10
Videotron
281
22%
3%
5%
88%
Within the service delivery category, problems with the quality of the service was the top issue reported, followed by complete loss of service. It is also notable that issues about customer cancelling their service after the provider failed to honour a due date related to installation was up by 50% compared to last year.
Table 7.22: Top 10 service delivery issues
Issue
Number
Intermittent/inadequate quality of service
3,626
Complete loss of service
1,218
Customer cancellation due date not kept/delayed
983
Unable to cancel service
808
Non-payment/collections-related
755
Install/activate due date not kept/delayed
719
Service repair/loss due date not kept/delayed
463
Unable to port
427
Installation error
364
Seasonal suspension
150
Intermittent/inadequate quality of service
Customers raised concerns about the quality of their service over 3,600 times across all types of service, which is about the same as last year. However, it’s notable that the number of intermittent/inadequate quality of service issues has not changed while overall issues are down 9% and complaints are down 19%, indicating that this is an area of increasing concern for customers.
Bell (22%), Rogers (11%) and Freedom Mobile (9%) were the top three providers with intermittent/inadequate quality of service issues. We note that Bell’s proportion of this issue is somewhat lower than expected considering it accounts for 31% of issues overall.
Table 7.23: Intermittent/inadequate quality of service issues by service type – Top 3 service providers
Service provider
Number of times issue was raised
Proportion of issue
Bell
784
22%
Rogers
404
11%
Freedom Mobile
324
9%
For internet customers, this is the leading issue, having been raised over 1,700 times, up 12% from last year and accounting for 47% of all intermittent/inadequate quality of service issues raised. (It was the second-most-raised issue for internet customers in the three preceding years.) Moreover, internet customers are raising this issue disproportionately: internet service accounts for 27% of all issues but 47% of intermittent/inadequate quality of service issues.
Table 7.24: Intermittent/inadequate quality of service issues by service type
Service type
Number
Proportion
Internet
1,707
47%
Wireless
1,194
33%
TV
386
11%
Phone
320
9%
Other
19
1%
There is also a disproportionate percentage of internet quality of service issues stemming from rural areas in Canada. While only 11% of all issues raised stem from rural customers, 21% of all internet quality of service issues raised are from rural customers. (Our classification of areas as “rural” or “urban” is as designated by Canada Post.)
Bell customers complained about quality of their internet service the most, with 389 issues, down 9% from last year. Bell accounts for a lower proportion of internet quality of service issues (23%) compared to its share of all internet issues (32%). Xplornet customers raised this issue 14% more often than last year and account for 15% of all internet quality of service issues, a large proportion given that they account for only 5% of all internet issues and only 1% of all issues across all types of service. Rogers is the third-leading service provider in this category, with 174 issues, up 34% from last year.
It’s also notable that although TELUS and Shaw are not among the top three providers in terms of internet service delivery issues, they have each seen significant increases in the number of internet quality issues reported, with increases of 79% and 47% respectively over last year.
Table 7.25: Internet quality of service issues – Top 3 service providers
Service provider
2019-20
YoY % Change
Bell
389
-9%
Xplornet
255
14%
Rogers
174
34%
Case Summary
Slower internet speed than customer expects
An internet customer experienced problems with his internet connection. He called his service provider to report that his internet speed had been reduced to about 100 Mbps. The customer informed the CCTS that his provider told him that it would look into the matter but that the troubleshooting ticket was subsequently closed without follow-up and without resolution of the service issues.
We investigated the matter when the customer filed a complaint with the CCTS. We worked with the provider to try to resolve the concern and found that attempts had been made to troubleshoot the customer’s service. During our investigation, the customer informed us that the provider had since provided a firmware upgrade that resolved the internet service issues. The customer was also provided compensation of $75. The customer was satisfied, and the matter was resolved.
Case Summary
Intermittent internet service issues
A wireless internet customer experienced intermittent service issues that he was unable to resolve with his provider, so he submitted a complaint to the CCTS.
The customer said his provider had advised him the problem was probably related to his router. The customer purchased a new router but the problem persisted. He wanted help in getting his service issues resolved and he also wanted to be reimbursed for the cost of the new router he had bought.
During our investigation, the provider informed us that due to the nature of the internet service, the customer may indeed experience degradation of service during peak usage times. While investigating the matter, the provider found that the tower from which the customer was receiving his wireless internet service was broadcasting two different types of service, which the provider described as “2.5 LTE and 3.5 LTE”. The provider switched the customer’s service to the 3.5 LTE, which the customer confirmed resolved some of his service delivery problems. In addition, the provider agreed to credit the customer for the amount he had spent to replace his router. The customer was satisfied with this course of action, and the complaint was resolved.
Case Summary
Proper investigation of intermittent internet service issues
An internet customer was experiencing intermittent service issues that he was unable to resolve with his service provider.
During the CCTS investigation of the complaint, the provider informed us that it had been working with the customer to resolve the issues. It confirmed that there was no known issue with its network. Each time the customer informed it that he was experiencing intermittent quality issues, the provider had sent a new modem to the customer’s home and confirmed that the service was subsequently working. The provider was able to demonstrate this through documentation submitted to the CCTS.
In addition, the provider was able to demonstrate that the customer was indeed making use of the service during the period in which he claimed the service did not work. Nonetheless, the provider offered to cancel the service, waive all cancellation fees and provide a one-month service credit of $82. The customer informed us that he was satisfied with the offer and would look into moving his business to another provider that could offer a more stable internet connection.
Case Summary
Correct troubleshooting of internet issues
An internet customer contacted the CCTS to complain that she had experienced very slow internet speeds from her service provider for a number of years. Her most recent attempts to resolve the matter had been unsuccessful, so she submitted a complaint to the CCTS. She informed us that she had subscribed to receive speeds of 5 Mbps; however, she claimed that often her speeds reached only 2.5 Mbps.
During our investigation of the complaint we determined that the customer was subscribed to an internet plan that included speeds of “up to” 5 Mbps. The provider’s terms of service do not guarantee the availability and/or the speeds of its services. Despite not having an obligation to provide uninterrupted service, the CCTS expects that the provider will complete troubleshooting with the customer when the service issues are brought forward.
A further review of the account records confirmed that four technician appointments took place in November and December 2019. During these appointments, the customer’s modem was changed and the lines were tested. In addition, the customer had been provided with a total of $561.24 over the years as compensation for service issues, including a recent credit that was applied to her account.
We found that the provider properly followed its troubleshooting procedure and that the service provided was within the terms agreed to by the customer. We explained this to the customer, who was satisfied with the investigation and agreed to close the complaint.
Key Message
Customers have very high demands for internet service quality. Service providers are aware of these high expectations and should be responsive to customer issues, help customers troubleshoot issues, and keep customers informed. Sometimes customer expectations cannot be met, either because of technology limitations or because customers are not aware of limitations in service plans, such as “up to” limits. In the latter case, full and proper disclosure to customers would help to decrease complaints. We urge service providers who are dealing with customer complaints to thoroughly explore the cause of the mismatch between their offer and the service the customer is receiving, and to adjust customer plans accordingly.
Credit management issues
There were 1,593 credit management issues reported this year, up 9% from last year. Credit management issues have increased 122% over the last five years.
Figure 7.10: Five-year view of credit management issues
Wireless customers account for more than half of all credit management issues (55%), followed by internet customers (23%).
Table 7.26: Credit management issues by service type
Service type
Number
Proportion
Wireless
877
55%
Internet
366
23%
TV
191
12%
Phone
159
10%
Bell accounted for 28% of the credit management issues. Rogers accounted for 13% and its customers raised this issue 71% more often than last year. TELUS accounted for 10% of credit management issues.
Table 7.27: Credit management issues – Top 10 providers
wdt_ID
Service provider
2019-20
YoY change
Proportion of all credit management issues
Proportion of all issues
Resolution rate
1
Bell
442
4%
28%
31%
81%
2
Rogers
209
71%
13%
12%
77%
3
TELUS
165
1%
10%
7%
78%
4
Virgin Mobile
131
48%
8%
5%
80%
5
Koodo
120
-13%
8%
3%
78%
6
Fido
110
83%
7%
5%
81%
7
Shaw
79
-16%
5%
5%
81%
8
Freedom Mobile
69
-12%
4%
5%
97%
9
Videotron
66
-24%
4%
5%
84%
10
Comwave
48
77%
3%
3%
93%
NOTE: The average resolution rate for all complaints across all service types is 89%.
Credit reporting
Ninety percent of the credit management issues are about credit reporting.
The increase is driven primarily by wireless customers, which account for 54% of credit reporting issues—a disproportionately high number when we consider that wireless customers account for 44% of issues overall.
It’s notable that only 81% of all credit reporting issues are resolved at some point of our process, lower than the average resolution rate of 89% for issues overall.
Bell had 377 credit reporting issues this year, up 3% from last year. Bell accounts for 26% of all credit reporting issues, a lower proportion than might be expected given that Bell accounts for 31% of all issues across all types of service.
Rogers had 203 credit reporting issues, up 75% from last year. It managed to resolve only 76% of these issues, less than the overall resolution rate for credit reporting issues (81%) and far lower than the overall resolution rate for all issues across all service types (89%).
TELUS had 157 credit reporting issues, down 2% from last year. TELUS accounts for 11% of credit reporting issues, somewhat higher than expected considering that it accounts for only 7% of all issues across all types of service.
Although not among the top three service providers for credit reporting issues, the number of times Virgin Mobile and Fido customers raised this issue increased significantly: 85% and 94% respectively.
Table 7.28: Credit reporting issues – Top 3 service providers
A customer cancelled her internet and TV services and returned the equipment her provider had given her. A number of months later, she received a collections notice from the provider stating that she had an overdue balance on her account. When she contacted her provider, it confirmed that it had in fact received the equipment and that she did not owe the amount indicated on the notice. A few months later, it came to her attention that the outstanding balance was still showing as owing and had been reported to a credit reporting agency, negatively impacting her credit rating. When she was unable to resolve this matter directly with her provider, she submitted a complaint to the CCTS.
During our investigation, we found that the customer had indeed returned the equipment to her provider after having cancelled the service and did not owe the money that had been reported to the collection agency. In fact, the customer had a credit balance on her closed account of almost $30. The provider investigated and reported to us that there had been a delay in processing the return of her equipment, which generated an outstanding balance that was reported to the credit reporting agency when it went unpaid. The provider called back the report from the credit reporting agency and indicated that it had been sent in error. The provider also refunded the customer the almost $30 that it owed to her. The customer was satisfied with this outcome, and the complaint was resolved.
Disconnection or suspension of service
There is an increase in the number of issues reported about suspension or disconnection of service. This year, this issue was raised 1,159 times by customers, an increase of about 6% in a year when overall issues are down 9% and complaints are down 19%.
This issue is being raised disproportionately by wireless customers, who account for 52% of the disconnection of service issues while only accounting for 44% of issues overall.
Table 7.29: Disconnection/suspension of service issues by service type
Service type
Number
Proportion
Wireless
601
52%
Internet
253
22%
TV
153
13%
Phone
147
13%
Long distance
5
0%
Although the number of breaches of the disconnection-related provisions in the Wireless Code are down almost 15% from last year, they still account for 19% of all Wireless Code breaches.
For local phone customers, we do not note any anomalies regarding the number or proportion of suspension/disconnection issues raised. However, we do note 9 breaches of the Deposits and Disconnections Code this year whereas no breaches were reported last year. Of these, 78% related to a provider failing to give the customer the required 14-day notice prior to disconnection.
Bell (28%), Rogers (16%) and Freedom Mobile (7%) were the top three providers with disconnection/suspension of service issues.
Table 7.30: Disconnection/suspension of service – Top 3 service providers
Service provider
Number of times issue was raised
Proportion of issue
Bell
320
28%
Rogers
187
16%
Freedom Mobile
79
7%
Case Summary
Lack of notice before disconnection
A local phone customer submitted a complaint to the CCTS after his service was disconnected without notice. During our investigation, we found that the customer had an unpaid balance of $678 on his previous account at his previous address and that according to the service provider’s terms of service, it had the right to disconnect his service. However, we found that the provider failed to notify the customer that his service was going to be disconnected and failed to inform him of what he was required to do to avoid the disconnection: this is contrary to section 3.2 of the Deposits and Disconnections Code. To remedy its error, the provider offered to credit the entire $678 owed by the customer and reconnect his service. The customer was satisfied and the complaint was resolved.
Working with Service Providers
Annual Report
August 1, 2019 – July 31, 2020
This section presents the results for those service providers that have been the subject of the greatest number of complaints and also discusses our Compliance Monitoring and Enforcement Program.
Top 25 Participating Service Providers
Table 8.1: Top 25 PSPs by complaints accepted
wdt_ID
Service provider
Accepted complaints
Percentage of all complaints
YoY % change of complaints accepted
Concluded complaints
Resolution rate*
Escalation rate†
% of escalations due to Section 6.6‡
1
Bell
3,815
24.4%
-35.1%
4,229
87.9%
34.6%
0.4%
2
Rogers
1,781
11.4%
-2.8%
1,768
86.2%
36.3%
1.9%
3
TELUS
1,166
7.4%
-27.6%
1,177
88.6%
24.1%
2.5%
4
Fido
1,123
7.2%
22.5%
1,087
87.3%
24.4%
1.9%
5
Freedom Mobile
1,066
6.8%
-7.1%
1,051
95.3%
15.1%
1.3%
6
Virgin Mobile
1,036
6.6%
-17.3%
1,036
90.5%
28.5%
0.0%
7
Shaw
771
4.9%
17.0%
754
90.7%
13.3%
4.0%
8
Koodo
687
4.4%
-9.0%
707
89.0%
17.1%
0.8%
9
Videotron
684
4.4%
-0.9%
665
93.1%
16.1%
3.7%
10
Comwave
393
2.5%
176.8%
261
90.0%
13.0%
35.3%
* Percentage of all resolved complaints vs. all concluded (89% overall)
† Percentage of all escalated complaints vs. all concluded (27% overall)
‡ Percentage of escalations due to Section 6.6 of Procedural Code (5.7% overall)
There are few changes to the Top 25 PSP list from last year. The Top 10 are discussed in more detail later in the Top 10 PSPs profiles.
In 2017-18 we reported a very high increase in complaints against Cogeco, most of these about internet service delivery issues. Last year, they had a 90% increase in complaints for all types of issues. In 2019-20, complaints against Cogeco decreased significantly, by 68.9%.
Cogeco also shows a modest improvement in the number of disclosure issues. Of the service providers in the preceding table, Xplornet, Bell Aliant, Public Mobile, Fizz and Acanac also showed modest decreases in the number of times this issue was raised by customers. By contrast, Comwave, Lucky Mobile, Distributel and ACN Canada all experienced increases in this issue over last year.
Comwave had a significant increase in complaints for all types of service and across all types of issues. Shaw Direct also had a large increase in complaints, with issues mainly driven by billing (98% increase), contract disputes (108% increase) and service delivery issues (124% increase).
Top 10 Participating Service Providers profiles
In this section, we identify areas of good performance as well as areas of improvement for the top 10 PSPs.
Bell
WirelessInternetPhoneTV
Insights
Bell complaints decreased by 35.1% compared to a 19% overall decrease in complaints. Bell accounts for 24.4% of all accepted complaints, down from 30.5% last year: a significant decline.
Wireless issues are proportionately lower compared to the overall outlook. Bell accounts for 36% of wireless issues compared to 44% for all service providers.
Issues related to TV and local phone are disproportionately high for Bell. TV issues account for 14% of issues for all service providers but for 18% of Bell issues. Local phone issues account for 13% of issues for all service providers but for 18% of Bell issues.
Bell’s proportion of internet issues is marginally higher than the overall proportion. Internet issues account for 27% of issues for all service providers but for 28% of Bell issues.
For all services, Bell complaints reveal a disproportionately high number of issues involving incorrect charges and lack of disclosure of important information compared to its overall number of issues for each service.
Regular price increase of monthly price plans is also raised disproportionately by Bell customers. Overall, this issue is down by 3%; however, this issue is up 13% for Bell.
Bell had 27 confirmed breaches of the Wireless Code, down from 46 last year—a significant decrease of 41% and representing 14.7% of all Wireless Code confirmed breaches (184).
Statistics
3,815 accepted complaints
35.1% decrease in accepted complaints
24.4% of all accepted complaints
3,716 resolved complaints
2,597 resolved at pre-investigation
1,119 resolved at investigation
87.9% resolution rate
35 Code breaches
27 Wireless Code breaches
1 Internet Code breach
5 TVSP Code breaches
2 D&D Code breaches
Rogers
WirelessInternetPhoneTV
Insights
Rogers’ complaints decreased by 2.8% compared to an overall decrease of 19% in complaints.
Rogers accounts for 11.4% of all accepted complaints, up from 9.5% last year.
The number of Rogers’ complaints that needed to be escalated has increased significantly, from 22% last year to 40% this year.
Rogers’ internet issues are up by 44%, local phone issues are up by 40%, TV issues are up by 26%, and wireless issues are up by 12%.
Issues related to wireless services are disproportionately high, accounting for 51% of all Rogers’ issues compared to 44% for all service providers.
Internet and local phone issues are proportionately lower than the overall proportion for all service providers. Rogers’ internet and local phone issues are 24% and 10%, respectively, while these issues are 27% and 13%, respectively, for all service providers.
The proportion of Rogers’ TV issues is marginally higher than that of all service providers, at 15% for Rogers compared to 14% for all service providers.
There are increases in all types of issues: a 71% increase in credit management issues, a 62% increase in service delivery issues, a 14% increase in contract disputes and an 11% increase in billing issues.
Rogers’ confirmed breaches of the Wireless Code decreased from 31 last year to 17 this year (a significant decrease of 45%), with most of its breaches in Section I (disconnection): 7 breaches this year compared to 3 last year).
Statistics
1,781 accepted complaints
2.8% decrease in accepted complaints
11.4% of all accepted complaints
1,524 resolved complaints
1,062 resolved at pre-investigation
462 resolved at investigation
86.2% resolution rate
18 Code breaches
17 Wireless Code breaches
0 Internet Code breaches
1 TVSP Code breach
0 D&D Code breaches
TELUS
WirelessInternetPhoneTV
Insights
TELUS complaints decreased by 27.6% compared to a 19% overall decrease in complaints. TELUS accounts for 7.4% of all accepted complaints, down from 8.3% last year.
Issues about wireless service account for 52% compared to 44% of issues for all service providers.
Internet, local phone and TV issues are proportionately lower compared to the overall outlook for all service providers.
While issues for all other services are down from last year, TELUS’ internet access service issues are up 23% from last year.
Service delivery issues across all types of service increased by 22%. Also, the proportion of service delivery issues increased from 17% last year to 24% this year.
Intermittent/inadequate quality of service is the most-raised service delivery issue, up by 66% from last year.
TELUS’ confirmed Wireless Code breaches fell by more than half, from 31 last year to 15 this year (a 45% decrease). There were 7 confirmed breaches of Section B (contracts and related documents), down from 28 last year, and also 7 confirmed breaches of Section I (disconnection), which had just 1 breach last year.
Statistics
1,166 accepted complaints
27.6% decrease in accepted complaints
7.4% of all accepted complaints
1,043 resolved complaints
839 resolved at pre-investigation
204 resolved at investigation
88.6% resolution rate
16 Code breaches
15 Wireless Code breaches
0 Internet Code breaches
1 TVSP Code breach
0 D&D Code breaches
Fido
WirelessInternet
Insights
While overall complaints decreased by 19%, Fido complaints increased by 22.5%. Fido accounts for 7.2% of all accepted complaints, up from 4.7% last year.
Overall wireless issues are down by 2% but Fido’s wireless issues are up by 25%.
Billing is the most complained-about issue for Fido customers. Overall, billing issues account for 44% of issues raised by all wireless customers; however, billing issues account for 48% of issues raised by Fido’s wireless customers.
Fido has an 83% increase in credit management issues, a 37% increase in service delivery issues, a 17% increase in contract disputes and a 34% increase in billing issues.
Relating to its increased billing issues, incorrect charge issues and credit/refund not received issues increased by 43% and 58%, respectively.
Relating to increased credit management issues, credit reporting issues increased by 94%.
Confirmed Wireless Code breaches increased slightly, with about 38% being related to issues with the 14-day disconnection notice requirements in Section I (disconnections): this is double the percentage for all service providers (19%).
Statistics
1,123 accepted complaints
22.5% increase in accepted complaints
7.2% of all accepted complaints
949 resolved complaints
762 resolved at pre-investigation
187 resolved at investigation
87.3% resolution rate
13 Code breaches
13 Wireless Code breaches
0 Internet Code breaches
0 TVSP Code breaches
0 D&D Code breaches
Freedom Mobile
Wireless
Insights
Freedom Mobile complaints decreased by 7.1% compared to a 19% overall decrease in complaints. Freedom accounts for 6.8% of all accepted complaints, up from 6% last year.
The number of complaints that needed to be escalated decreased by 31%. Last year 22% of Freedom Mobile’s complaints were escalated whereas this year only 15% were escalated.
Billing issues are proportionately lower than for all service providers: 35% for Freedom Mobile compared to 41% for all service providers.
Service delivery issues are disproportionately higher for Freedom Mobile’s customers: 29% compared to 24% for all service providers.
Contract dispute and credit management issues have about the same proportional distribution as for all service providers.
All of the following issues increased this year: legitimacy of early termination fee (ETF) (up by 21%); disclosure issues (up by 16%); breach of contract (up by 14%); and no consent provided (up by 14%).
Confirmed Wireless Code breaches decreased by over 95%, from 25 last year to just 1 this year.
Statistics
1,066 accepted complaints
7.1% decrease in accepted complaints
6.8% of all accepted complaints
1,002 resolved complaints
868 resolved at pre-investigation
134 resolved at investigation
95.3% resolution rate
1 Code breach
1 Wireless Code breach
0 Internet Code breaches
0 TVSP Code breaches
0 D&D Code breaches
Virgin Mobile
WirelessInternetPhone
Insights
Virgin Mobile complaints decreased by 17.3% compared to a 19% overall decrease in complaints. Virgin Mobile complaints account for 6.6% of all accepted complaints, almost unchanged from 6.5% last year.
Although wireless service issues are down by 12% this year, internet service issues are up by 53%.
While overall wireless billing issues for all service providers are down by 4%, Virgin Mobile’s wireless billing issues are down by 10%. The situation is similar for wireless contract dispute issues, which are down by 8% for all service providers but down by 23% for Virgin Mobile. Wireless service delivery issues are up by 10% overall but for Virgin Mobile these issues are down by 5%.
Wireless credit management issues increased more for Virgin Mobile than for all service providers: a 47% increase for Virgin Mobile compared to a 22% increase for all service providers.
Overall internet issues relating to incorrect charge are down by 23%; however, internet incorrect charge issues for Virgin Mobile are up by 44%. Also, credit/refund not received issues are up 6% for all service providers’ wireless customers but are double that percentage—up 12%—for Virgin Mobile’s wireless service customers. Credit reporting-related issues are up by 24% for all service providers’ wireless customers but are up by 88% for Virgin Mobile’s wireless customers: more than triple the overall increase.
Virgin Mobile’s confirmed Wireless Code breaches fell by half, from 8 last year to 4 this year.
Statistics
1,036 accepted complaints
17.3% decrease in accepted complaints
6.6% of all accepted complaints
938 resolved complaints
700 resolved at pre-investigation
238 resolved at investigation
90.5% resolution rate
5 Code breaches
4 Wireless Code breaches
1 Internet Code breach
0 TVSP Code breaches
0 D&D Code breaches
Shaw
InternetPhoneTV
Insights
Compared to an overall decrease of 19% in complaints, Shaw complaints increased by 17%. Shaw complaints account for almost 5% of all accepted complaints, up from 3.4% last year.
Shaw’s internet access service issues increased by 22% compared to an overall decline in these issues of 2%.
Although Shaw accounts for 6% of contract dispute issues, it accounts for a disproportionate percentage of Legitimacy of early termination fee (ETF) issues (14%).
Shaw accounts for a disproportionately high percentage of unable-to-cancel issues: 14%, up from 3% last year.
Statistics
771 accepted complaints
17.0% increase in accepted complaints
4.9% of all accepted complaints
684 resolved complaints
615 resolved at pre-investigation
69 resolved at investigation
90.7% resolution rate
0 Code breaches
0 Wireless Code breaches
0 Internet Code breaches
0 TVSP Code breaches
0 D&D Code breaches
Koodo
Wireless
Insights
Koodo complaints decreased by 9% this year compared to a 19% overall decrease in complaints. Koodo accounts for 4.4% of all accepted complaints, up from 3.9% last year.
While Koodo accounts for about 3% of overall issues raised, it accounts for a disproportionate percentage of credit management issues (8%) and credit reporting issues (8%).
Koodo had no breaches of the Wireless Code in the last two years but had the most breaches this year, with 101 breaches—50% of all confirmed breaches and more than three times the number of breaches by any other service provider. Of these breaches, 48.5% related to Section B (contracts and related documents) and 43.6% related to Section C (critical information summary).
Statistics
687 accepted complaints
9.0% decrease in accepted complaints
4.4% of all accepted complaints
629 resolved complaints
554 resolved at pre-investigation
75 resolved at investigation
89.0% resolution rate
101 Code breaches
101 Wireless Code breaches
0 Internet Code breaches
0 TVSP Code breaches
0 D&D Code breaches
Videotron
WirelessInternetPhoneTV
Insights
Compared to a 19% overall decrease in complaints, Videotron’s complaints decreased by 0.9%. Videotron complaints account for 4.4% of all accepted complaints, up from 3.6% last year.
Videotron’s complaints reveal a disproportionately high number of issues involving internet, TV and local phone. Internet issues account for 31% of all Videotron issues compared to 27% for all service providers; TV issues account for 23% compared to 14% for all service providers; and local phone issues account for 15% compared to 13% for all service providers.
Wireless issues are proportionately lower than for all service providers: 30% for Videotron compared to 44% for all service providers.
While Videotron accounts for 6% of all billing issues, it accounts for a disproportionately high percentage of credit/refund not received issues (10%). There was also a 51% increase in the number of times this issue was raised by its customers compared to last year.
Disclosure issues increased by 54% compared to a 10% increase of the same issue for all service providers.
Videotron had four confirmed breaches of the Wireless Code. Although this is the same number as last year, all of last year’s confirmed breaches were related to Section E (bill management) while all of this year’s confirmed breaches were related to Section I (disconnection).
Statistics
684 accepted complaints
0.9% decrease in accepted complaints
4.4% of all accepted complaints
619 resolved complaints
546 resolved at pre-investigation
73 resolved at investigation
93.1% resolution rate
4 Code breaches
4 Wireless Code breaches
0 Internet Code breaches
0 TVSP Code breaches
0 D&D Code breaches
Comwave
InternetPhoneTV
Insights
Although overall complaints decreased by 19%, Comwave’s complaints increased by 176.8%. Comwave accounts for 2.5% of all accepted complaints, up significantly from 0.7% last year.
Comwave had a 127% increase in internet service access-related issues and a 133% increase in issues about local phone service.
The increase in Comwave’s issues is to almost all issue types, with the top five being:
Legitimacy of early termination fee (ETF): 82, a 100% increase
Amount of ETF: 64, a 400% increase
Disclosure issues: 58, a 113% increase
Equipment charges: 43, a 537% increase
Credit/refund not received: 37, a 231% increase)
Compared to no confirmed breaches of the D&D Code last year, Comwave had three confirmed breaches this year. These breaches are related to Section 3.2 Notice at least 14 days prior (2 confirmed breaches) and Section 3.3 Advise customer 24 hours prior (1 confirmed breach).
Statistics
393 accepted complaints
176.8% increase in accepted complaints
2.5% of all accepted complaints
235 resolved complaints
204 resolved at pre-investigation
31 resolved at investigation
90% resolution rate
3 Code breaches
0 Wireless Code breaches
0 Internet Code breaches
0 TVSP Code breaches
3 D&D Code breaches
Monitoring service provider compliance
There are two categories of service provider requirements: the CRTC requirement to participate in the CCTS and the CCTS requirements after a provider becomes a Participating Service Provider (PSP).
To ensure the CCTS can provide free and effective service to customers when they need it, the CRTC requires companies that provide retail telecom services in Canada as well as licensed TV service providers to participate in the CCTS. Some service providers (typically small providers or new entrants to the business) do not currently participate. Their obligation to join is triggered when one of their customers files a complaint with the CCTS.
We do everything in our power to get these service providers to join, and we’re generally successful. This year it took us, on average, 34 days to sign up a new provider from the time they were informed of their requirement to participate.
In 2019-20 we signed up 35 new service providers. However, some providers refuse to join the CCTS. If we’re unable to persuade them to follow the rules and become a PSP, we refer the matter to the CRTC for further action. We also publicize the identities of providers failing to join the CCTS when required on our Non-compliant providers web page.
After a provider has become a PSP, it is required to adhere to the CCTS obligations outlined in the Participation Agreement.
In 2018 the CCTS began to monitor and audit PSPs to determine if they were:
Complying with the CCTS Procedural Code, which contains rules for investigating complaints
Paying their fees and disclosing certain financial information
In May of 2019, we issued the first Compliance Monitoring Report, which explains the preceding CCTS compliance requirements in detail and provides the 2018 results of the Compliance Monitoring and Enforcement Program.
The most recent Compliance Monitoring Report is available on our website.
Working with Customers
Annual Report
August 1, 2019 – July 31, 2020
We’re always looking for ways to help customers find out about our complaint-handling process and make it easier for them to access our services. This section discusses our activities and results in 2019-20.
Website
Our website is a key tool for helping customers find us. According to our customer surveys, 31% of customers report first learning about the CCTS through an online search. This percentage is the same as last year’s results.
Our website is also a focus for customers who want to file complaints. In 2019-20, 87% of the complaints we accepted were filed by customers using the “Submit a Complaint” interactive questionnaire on the website.
There were close to 467,000 website visits this year, a decrease of 7% from last year. However, website visits have increased in recent years as ever-more people go online to use self-service tools. This was the case with the “Submit a Complaint” interactive questionnaire, which had 50,000 sessions last year but close to 57,000 sessions this year.
Accessibility
The CCTS has always been mindful of its responsibility to be responsive to the diverse needs of the public and to provide everyone with an equal opportunity to use our services, in line with the best practices of the Accessible Canada Act, which was passed in June of 2019 and provides for the development of accessibility standards. Providing accessible customer service so that persons with disabilities can reach us easily and make use of our processes is one of our core values. We provide customer service in a manner that accommodates persons with disabilities and reflects the principles of independence, dignity, integration and equality of opportunity.
We provide training on accessible customer service to all the CCTS employees, directors, volunteers and others who communicate with the public or third parties on behalf of the CCTS.
We also conduct annual consultations with groups representing Canadians with disabilities. Based on their feedback, all of our videos are closed captioned and have an American Sign Language/Langue des signes québécoise (ASL/LSQ) version.
In 2020, we had consultations with participants from five accessibility groups. We learned that the CCTS is still not well known throughout the accessibility community. The participants expressed a willingness to help us spread the word within their networks though their websites, newsletters and town halls. The CCTS will invest its time and provide materials to help with this process.
We also learned that some functionalities on the CCTS website require attention to improve usability for disabled users. These issues will be addressed early in the 2020-21 fiscal year.
Every two years, we perform an accessibility analysis of our website to ensure that current content plus any new content added meets the Web Content Accessibility Guidelines (WCAG) 2.1.
As of the 2018-2019 Mid-Year Report, our annual and mid-year reports are provided in HTML format for accessibility, to optimize the reading experience for those who use screen readers and other assistive technology. (Previous mid-year and annual reports are provided in PDF versions that are tagged for accessibility.)
At the request of the CRTC and members of the accessibility community, we have also implemented a process to track accessibility-related issues that appear in customer complaints.
“The CCTS resolved the problem in 2 days after I had tried for a month.”
Customer survey results
We survey customers who use our service for two reasons:
to get their impressions of the work we do and refocus our efforts for improvement
to attempt to measure the success of the public awareness initiatives we undertake with service providers
The results are based on close to 4,700 responses. We thank the customers who took the time to participate in the survey and share their views.
Numbers for all results were rounded.
What customers said about the CCTS
We asked our customers for the following information:
Is it important to have an independent organization to deal with telecom and TV complaints that has the authority to provide customers with compensation?
Was it easy to file your complaint with the CCTS?
Feedback on whether the service you received from our customer service representatives met your expectations.
Feedback on whether the service you received from our complaint resolution officers met your expectations.
Feedback on overall sense of satisfaction with various aspects of our process.
Timelines: Did we complete our work in a reasonable amount of time?
Professionalism: Were we professional, knowledgeable and courteous?
Impartiality: Did we act without favoritism to either you or your service provider?
What customers said about service provider public awareness activities
How did you first find out about the CCTS?
Service providers have committed to notify customers about the CCTS during their internal complaint-handling process. We asked our customers:
Did your service provider tell you about the CCTS during your efforts to resolve the problem?
Service providers are required to print a prescribed message about the CCTS on customer bills four times a year. We asked our customers:
Have you ever seen the notice on any of your bills?
Service providers have committed to placing a prescribed notice about the CCTS in a reasonably prominent place on their websites and to include a link to the CCTS website. We asked our customers:
Have you seen this notice and link?
“Our service provider resolved the issues within a few days after we submitted a complaint.”
What customers said about their interactions with service providers concerning issues
We asked customers about their interactions with service providers before the CCTS became involved.
How long did you try to resolve your problem directly with your service provider before bringing your complaint to the CCTS?
How many levels of escalation (front line customer service, supervisor, manager, etc.) did your complaint go through with the service provider before you filed a complaint with the CCTS?
Statistical Reports
Annual Report
August 1, 2019 – July 31, 2020
Contact Centre activities
Our Contact Centre received over 122,000 communications by telephone, in writing and by online chat, down from 142,000 last year.
Table 10.1: Communications received
Type of communication
2019-20
YoY change
Written correspondence
42,137
-16%
Phone calls answered
76,084
-14%
Chat sessions answered
3,948
-9%
Phone calls continue to be the most-used type of communication, followed by written correspondence (which includes use of our online interactive questionnaire) and chat sessions. All types of communication decreased this year.
Out-of-mandate issues
The following tables show the number of issues raised by customers that the CCTS could not accept in 2019-20 due to the procedural rules in our Procedural Code.
Section 3.1(b)(i) Digital Media Broadcast Undertaking (DMBU) services
104
Section 3.1(b)(ii) Interactive TVSP services and applications
24
Section 3.1(b)(iii) Broadcasting content
708
Section 3.1(b)(iv) Journalistic ethics
91
Section 3.1(b)(v) TV accessibility issues, e.g., closed captioning and described video
57
Section 3.1(b)(vi) Simultaneous substitution
36
Section 3.1(c)(i) Customer-owned equipment
247
Section 3.1(c)(ii) Inside wiring
47
Section 3.1(c)(iii) Security services
153
Section 3.1(c)(iv) Networking services
349
Section 3.1(c)(v) Pricing
1,662
Section 3.1(c)(vi) Rights of way
144
Section 3.1(c)(vii) Plant/poles/towers
1,160
Section 3.1(c)(viii) False/misleading advertising
502
Section 3.1(c)(ix) Privacy issues
1,001
Other – Broadcasting (television)
243
Other – Broadcasting (radio)
67
Other – Consumer – clarity of offers and promotions (TVSP Code)
121
Other – Not related to service providers (phone/internet scams)
656
Other – Regulated services
50
Other – Aggressive tactics*
175
Other – Spam*
6
Total
8,866
* Not reported on last year
The total number of these issues that were reported on both last year and this year are down somewhat, from 10,119 last year to 8,669 this year.
Pricing remains the top issue, and issues related to false/misleading advertising increased slightly despite the overall decrease in issues. These types of issues were included in the CRTC’s investigation of aggressive and misleading sales practices. The CRTC published its report on this topic in February of 2019. At the request of the CRTC, in 2019-2020 we added aggressive tactics and spam to our reporting. Although all of these issues are out of mandate, they relate to the top in-mandate issues for 2019-2020: contract conflicts with agreement and details of promotion not fully disclosed. For a detailed discussion of these issues, see the section Topics and Trends.
It’s noteworthy that issues related to clarity of offers and promotions (TVSP Code) decreased by over 62%.
Table 10.3: Procedural Code Section 4
Issue
Number
Section 4.1 Customer service
Language barriers
274
Outsourcing
375
No phone number for customer service
571
Rude representative
2,976
Wait times
4,042
Total
8,238
Section 4.3 General operating practices and policies
5,337
Total
13,575
Complaints about the quality of customer service delivered by providers do not fall within the CCTS mandate. However, we track the inquiries we get about these issues.
In 2019-20 there were 13,578 issues, an increase of over 15% from last year.
Table 10.4: Procedural Code Section 10: Duty To Decline To Take Action
Issue
Number
Section 10.1 Service provider not offered opportunity to resolve
1,336
Section 10.2(b) Matter previously or currently with another agency
1,258
Section 10.3(a) Facts transpired more than one year ago
1,539
Section 10.3(b) Facts arose prior to effective date
53
Total
4,186
The only increase was in complaints that customers tried to file in which facts took place more than one year earlier, which showed a 13.4% increase over last year.
Although complaints about a service provider’s failure to accommodate customer accessibility requests are out of our mandate, at the request of the CRTC and members of the accessibility community, we track when customers raised accessibility issues about their service providers. We also refer these issues to the proper organization, the CRTC.
Table 10.5: Accessibility issues
Section
Number
Contract not provided in alternative format
1
Policies and operating procedures
17
Customer was refused an accessibility plan
2
Customer service: Indifference to customer’s disability
36
Emergency services
2
Hearing and speech issues: Lack of in-store language accessibility MRS not available VRS not available
Total
2 2 2
6
Visual issues: Bills and other information not provided in alternative format
10
Mobility issues: Lack of in-store physical accessibility
0
Special type of wireless device handset not offered
3
TV accessibility issues
57
Other issues
9
Total
143
Complaints about TV accessibility issues decreased substantially, from 105 last year to 57 this year.
Small business
In 2019-20, we had 1,182 complaints from small business customers, 7.4% of all concluded complaints.
When we report our operational statistics, we include the data for all the complaints we dealt with during the year. However, not all complaints are alike. In particular, we know that complaints from small business customers can be quite different from those of individual consumers. The following tables highlight the differences.
The small business percentages are similar to last year’s results.
Unlike the previous two years, when internet access services had the most complaints, this year wireless services had the most, up from 30.5% last year to almost 36% this year.
Table 10.6: Small business complaint subjects vs. consumer complaint subjects
Subject
Small business
Consumer
Contract dispute
47.0%
30.5%
Billing
30.8%
41.5%
Service delivery
19.6%
24.2%
Credit management
2.6%
3.8%
Total
100%
100%
Table 10.7: Small business complaint service types vs. consumer complaint service types
Service
Small business
Consumer
Internet
32.3%
27.0%
Local phone
30.2%
11.9%
Wireless
36.3%
45.0%
Long distance
1.2%
1.2%
Table 10.8: Top 10 small business complaint issues
Issue
Small business
Consumer
Disclosure issues
14.0%
14.1%
Incorrect charge
10.4%
13.1%
Legitimacy of early termination fee (ETF)
8.7%
2.5%
Intermittent/Inadequate quality of service
6.4%
8.6%
Breach of contract
5.8%
5.5%
Credit/refund not received
4.1%
5.3%
Auto-renewal
3.6%
0.0%
No consent provided
3.6%
1.8%
Amount of ETF
3.5%
0.9%
Material contract change without notice
2.5%
2.6%
Analysis of closed complaints
Our operational statistics show that we closed 1,732 complaints in 2019-20. The following table provides a breakdown of the reasons why those complaints were closed, with reference to the relevant section of the Procedural Code.
Table 10.9: Complaints closed by reason for closure
Complaint
Issues
%
Closed as duplicate
6
0.3%
Customer withdraws complaint
214
12.4%
Out-of-mandate after further information obtained
20
1.2%
Phone consultation
3
0.2%
Section 9.1(b) Customer is not authorized to file complaint
11
0.6%
Section 9.1(c) Complaint more appropriately handled by another agency
13
0.8%
Section 9.1(d) Further investigation not warranted
422
24.4%
Section 9.1(e) Customer not cooperative
740
42.7%
Section 9.1(f) Service provider offer is reasonable
182
10.5%
Section 10.2(b) Matter previously or currently with another agency
12
0.7%
Section 10.3(a) Complaint filed outside time limits
11
0.6%
Section 10.3(b) Facts arose prior to effective date
98
5.7%
Total
1,732
100%
Compensation analysis
In cases that are resolved as well as in Recommendations and Decisions, customers may receive some form of compensation from their service provider. This compensation can take many forms, including:
bill credits
bill adjustments
free or discounted products and services
cash payments
We attempt to record the value of all compensation awarded to customers as a result of the CCTS process. This is challenging because in a significant number of cases (in particular, resolutions that occur at our Pre-investigation stage) we are not provided with the details of the settlement reached between the customer and the service provider.
The total compensation awarded was $2,734,058.51.
Table 10.10: Number of complaints in which compensation was awarded
Compensation range
Number of complaints
Percentage
< $100
3,584
40.0%
$100 – $499
4,107
45.8%
$500 – $999
798
8.9%
$1,000 – $4,999
451
5.0%
$5,000 or more
25
0.3%
Total
8,965
100%
“I was getting nowhere with my provider but saw immediate action when the CCTS got involved.”
Performance standards
Each year, we set ourselves a goal of great customer service. To ensure that we’re meeting that goal, we track our performance across various benchmarks.
Table 10.13: Complaints accepted by province/territory performance standards
Province
Complaints
Population
Alberta
1,411
9.0%
4,428,247
11.7%
British Columbia
2,013
12.9%
5,120,184
13.5%
Manitoba
483
3.1%
1,379,121
3.6%
New Brunswick
220
1.4%
780,890
2.1%
Newfoundland and Labrador
139
0.9%
520,437
1.4%
Northwest Territories
6
0.0%
44,982
0.1%
Nova Scotia
343
2.2%
978,274
2.6%
Nunavut
7
0.0%
39,486
0.1%
Ontario
6,957
44.4%
17,745,040
38.8%
Prince Edward Island
72
0.5%
158,717
0.4%
Quebec
3,550
22.7%
8,552,362
22.5%
Saskatchewan
145
0.9%
1,181,987
3.1%
Yukon
23
0.1%
41,293
0.1%
Not specified
292
1.9%
Total
15,661
100%
37,971,020
100%
Governance
Annual Report
August 1, 2019 – July 31, 2020
Board of Directors
Our Board is structured to provide for the participation of all stakeholders while remaining independent from the telecom and TV industries. It consists of seven directors who are elected for three-year terms:
four independent directors, two of whom are appointed by consumer groups
three industry directors, one each to represent the Incumbent Local Exchange Carriers (ILECs), the cable companies and the other Participating Service Providers
Independent directors
Catherine Aczel Boivie, PhD, ICD.D (Board Chair, appointed October of 2016)
A senior executive and CEO, Catherine has led the advancement of the strategic value of information technology as a business enabler at Vancity Credit Union, Pacific Blue Cross and CAA British Columbia. She serves on several boards, including those of BC Real Estate Association (BCREA), Canada Foundation for Innovation (CFI), MedicAlert Canada and Artsclub theatre. More…
Darlene Halwas
Darlene currently serves on the boards of Canada Development Investment Corporation, CMC Research Institutes and the Alberta WaterPortal Society. She has almost 30 years of work experience, with 15 years focused on leading risk management functions for companies. More…
Independent directors: Consumer group appointees
Marina Pavlović
Marina is an Associate Professor at the University of Ottawa’s Faculty of Law, Common Law Section, where she is a member of the Center for Law, Technology, and Society. Marina has research and teaching experience in consumer protection, telecommunications, law and technology policy, and dispute resolution. More…
Jacques C.P. Bellemare
Jacques graduated in Engineering Physics at École Polytechnique in Montreal (1961) and later obtained an MBA from Laval University in Quebec (1973). In the private sector, he has worked in telephony with Bell Canada, in cable TV with Cablevision Nationale (acquired by Videotron), in consulting with Raymond, Chabot, Martin, Paré, and in regulation with Teleglobe Canada after its privatization. More…
Industry directors: Incumbent Local Exchange Carriers (ILECs)
Ruby Barber
Ruby is Assistant General Counsel, Legal & Regulatory Affairs, at Bell Canada and is based in Ottawa. She joined Bell in 1997 and has a broad range of legal and regulatory experience with telecom issues. More…
Industry directors: Cable companies
Dean Shaikh
Dean is Vice President, Regulatory Affairs at Shaw Communications, where he is primarily responsible for CRTC proceedings and compliance under the Broadcasting Act. He also provides advice on matters involving the Telecommunications Act, Competition Act and Copyright Act. More…
Industry directors: Other Participating Service Providers
Geoff Batstone
Geoff is the Vice President, General Counsel at Distributel Communications where he is responsible for managing the legal, regulatory and public policy affairs of the Distributel group of companies. Called to the bar in 1995, he has over twenty years of experience working in diverse legal environments, advising a range of clients from small start-ups to multinational companies. More…
For up-to-date biographies throughout the year, see our Board of Directors web page.
Meetings and director attendance
wdt_ID
Board meeting date
Aczel Bolvie
Barber
Batstone
Bellemare
Halwas
Pavlović
Shaikh
1
October 10, 2019 (teleconference)
Yes
Yes
Yes
Yes
Yes
Yes
Yes
2
October 16, 2019
Yes
Yes
Yes
Yes
Yes
Yes
Yes
3
December 18, 2019 (teleconference)
Yes
Yes
Yes
Yes
Yes
Yes
Yes
4
January 29, 2020
Yes
Yes
Yes
Yes
Yes
No
Yes
5
April 28 and 29, 2020 (video conference)
Yes
Yes
Yes
Yes
Yes
Yes
Yes
6
June 18 and 19, 2020
Yes
Yes
Yes
Yes
Yes
Yes
Yes
Committees and working groups: Membership and meetings
The Board has the following committees and working groups. Membership and meeting dates are as follows.
Audit Committee
August 1 to October 16: Darlene Halwas (Chair), Jacques C.P. Bellemare, Dean Shaikh.
October 17 to July 31: Darlene Halwas (Chair), Marina Pavlović, Ruby Barber.
Meetings: October 2 and December 4, 2019, and January 15, March 12, April 15, June 10 and July 22, 2020.
Corporate Governance Committee
August 1 to October 16: Catherine Aczel Boivie (Chair), Geoff Batstone, Marina Pavlović.
October 17 to July 31: Catherine Aczel Boivie (Chair), Geoff Batstone, Jacques C.P. Bellemare.
Meetings: August 21, September 18 and October 10, 2019, and January 14, March 26, April 14, June 1, June 3 and June 10, 2020.
Independent Directors Committee
Catherine Aczel Boivie, Jacques C.P. Bellemare, Darlene Halwas, Marina Pavlović.
Meetings: October 2 and 15, 2019, and January 27, April 27 and June 17, 2020.
Budget Working Group
Marina Pavlović, Dean Shaikh.
Meetings: June 2, 8, and 12, 2020.
CCTS budget
The CCTS audited financial statements for 2019-20 can be found in Appendix C. The CCTS is funded by the service providers. Large providers pay a fee based on the proportion of their revenues to the revenues of all the large service providers. Small providers pay an annual fee. All providers pay a fee for each complaint concluded by the CCTS from their customers in the year. New provider sign-up fees and bank interest make up the other sources of revenue.
In 2019-20 the CCTS recorded revenues significantly below those projected because the number of complaints actually received and concluded were substantially below the forecasts made at the beginning of the fiscal year. Nonetheless, through judicious management of spending, CCTS finished the year with a surplus.
Under the Participation Agreement that governs the relationship between the CCTS and PSPs, the CCTS normally credits the excess of revenues over expenses back to the service providers as a year-end adjustment. In 2019-20, the CCTS Members decided to retain the surplus and earmark it to defray future anticipated technology upgrade costs, which are related to implementation of service delivery improvements.
Below are some terms used throughout the report and their definitions.
Accepted complaint
A customer complaint received during the year and which falls within the CCTS’ mandate, sometimes referred to simply as a “complaint”.
Alleged breach
When a customer claims that the service provider failed to perform an obligation under one of the four CRTC-developed codes of conduct the CCTS administers (the D&D Code, the Wireless Code, the TVSP Code and the Internet Code) or when a CCTS staff member identifies a potential code breach based on the details of a complaint. Each breach references an individual section of the code. As a result, more than one alleged breach may be recorded in a complaint.
Assessment
We assess the information the customer has provided to determine if, based on our mandate, we are able to accept a complaint.
Closed complaint
A complaint that was accepted and then subsequently closed. CCTS may close the complaint for various reasons, including any of the following:
The service provider has made an offer to resolve the complaint that we think is fair and reasonable based on the specific circumstances of the complaint.
The complaint was found to be without merit.
After filing the complaint, the customer either withdrew it or failed to provide the information we needed to conduct our investigation.
The complaint should more properly have been brought before another agency, tribunal or court.
Concluded complaint
A complaint that we accepted and disposed of by resolving it, closing it, or issuing either a Recommendation or Decision. The complaint may have been accepted during the current calendar year or the preceding calendar year but was concluded during the fiscal year (August to July) in which it is reported.
Confirmed breach
When we can confirm, based on our investigation, that a provision of a code has been breached.
Customer not cooperative
When a customer files a complaint but fails to provide the information we need to conduct our investigation. In this situation, the complaint is closed.
Decision
A Decision is issued if either the customer or the service provider rejects the CCTS Recommendation. The party rejecting the Recommendation must set out its reasons and the Commissioner will reconsider the Recommendation and issue a Decision. The Commissioner may confirm the original Recommendation or, if the Commissioner concludes that there is substantial doubt as to the correctness of the Recommendation, the Commissioner may modify the Recommendation as appropriate. A Decision is binding on the service provider but not on the customer. The customer may reject it and pursue other remedies.
Further investigation not warranted
When we determine, after assessment, that an investigation or a further investigation is not necessary because we determine that the service provider has reasonably performed its obligations to the customer.
Investigation
We analyze the evidence provided and use this analysis to suggest ways in which the complaint might be resolved amicably.
Issue
A specific concern expressed by the customer in the complaint. Many complaints raise more than one issue. For example, a customer may complain that their invoice contains a billing error and that the unpaid balance resulted in a service disconnection. This would be considered one complaint that raises two issues.
No breach
When we have investigated an alleged breach and concluded that the service provider did not breach the code in question.
Out of mandate
Complaints about products, services or issues that we cannot investigate are considered to be “out of mandate.”
Pre-investigation
The stage of our process where the parties have 30 days to resolve the customer’s complaint, failing which we will begin an investigation to assess whether the service provider reasonably performed its obligations to the customer.
Recommendation
The complaint was fully investigated. Often, the service provider has not made an offer to informally resolve the complaint or the offer is not found to be reasonable based on the specific circumstances of the complaint. We will make a Recommendation requesting that the provider take specific actions to resolve the matter.
Resolved
The complaint was informally resolved with the assistance of a CCTS team member to the satisfaction of both the customer and the Participating Service Provider.
Service provider offer is reasonable
When the service provider makes an offer to resolve a complaint and the CCTS determines that the offer fairly resolves the problem. In this situation, the complaint is closed.