Statistical Reports
Annual Report
August 1, 2019 – July 31, 2020
Contact Centre activities
Our Contact Centre received over 122,000 communications by telephone, in writing and by online chat, down from 142,000 last year.
| Type of communication | 2019-20 | YoY change |
|---|---|---|
| Written correspondence | 42,137 | -16% |
| Phone calls answered | 76,084 | -14% |
| Chat sessions answered | 3,948 | -9% |
Phone calls continue to be the most-used type of communication, followed by written correspondence (which includes use of our online interactive questionnaire) and chat sessions. All types of communication decreased this year.
Out-of-mandate issues
The following tables show the number of issues raised by customers that the CCTS could not accept in 2019-20 due to the procedural rules in our Procedural Code.
| Issue | Number |
|---|---|
| Section 3.1(a)(i) Internet applications/content | 394 |
| Section 3.1(a)(ii) Emergency services | 111 |
| Section 3.1(a)(iii) Payphones | 4 |
| Section 3.1(a)(iv) Yellow pages/business directories | 28 |
| Section 3.1(a)(v) Telemarketing/unsolicited messages | 701 |
| Section 3.1(a)(vi) 900/976 calls | 25 |
| Section 3.1(b)(i) Digital Media Broadcast Undertaking (DMBU) services | 104 |
| Section 3.1(b)(ii) Interactive TVSP services and applications | 24 |
| Section 3.1(b)(iii) Broadcasting content | 708 |
| Section 3.1(b)(iv) Journalistic ethics | 91 |
| Section 3.1(b)(v) TV accessibility issues, e.g., closed captioning and described video | 57 |
| Section 3.1(b)(vi) Simultaneous substitution | 36 |
| Section 3.1(c)(i) Customer-owned equipment | 247 |
| Section 3.1(c)(ii) Inside wiring | 47 |
| Section 3.1(c)(iii) Security services | 153 |
| Section 3.1(c)(iv) Networking services | 349 |
| Section 3.1(c)(v) Pricing | 1,662 |
| Section 3.1(c)(vi) Rights of way | 144 |
| Section 3.1(c)(vii) Plant/poles/towers | 1,160 |
| Section 3.1(c)(viii) False/misleading advertising | 502 |
| Section 3.1(c)(ix) Privacy issues | 1,001 |
| Other – Broadcasting (television) | 243 |
| Other – Broadcasting (radio) | 67 |
| Other – Consumer – clarity of offers and promotions (TVSP Code) | 121 |
| Other – Not related to service providers (phone/internet scams) | 656 |
| Other – Regulated services | 50 |
| Other – Aggressive tactics* | 175 |
| Other – Spam* | 6 |
| Total | 8,866 |
* Not reported on last year
The total number of these issues that were reported on both last year and this year are down somewhat, from 10,119 last year to 8,669 this year.
Pricing remains the top issue, and issues related to false/misleading advertising increased slightly despite the overall decrease in issues. These types of issues were included in the CRTC’s investigation of aggressive and misleading sales practices. The CRTC published its report on this topic in February of 2019. At the request of the CRTC, in 2019-2020 we added aggressive tactics and spam to our reporting. Although all of these issues are out of mandate, they relate to the top in-mandate issues for 2019-2020: contract conflicts with agreement and details of promotion not fully disclosed. For a detailed discussion of these issues, see the section Topics and Trends.
It’s noteworthy that issues related to clarity of offers and promotions (TVSP Code) decreased by over 62%.
| Issue | Number | |
|---|---|---|
| Section 4.1 Customer service | ||
| Language barriers | 274 | |
| Outsourcing | 375 | |
| No phone number for customer service | 571 | |
| Rude representative | 2,976 | |
| Wait times | 4,042 | |
| Total | 8,238 | |
| Section 4.3 General operating practices and policies | 5,337 | |
| Total | 13,575 | |
Complaints about the quality of customer service delivered by providers do not fall within the CCTS mandate. However, we track the inquiries we get about these issues.
In 2019-20 there were 13,578 issues, an increase of over 15% from last year.
| Issue | Number |
|---|---|
| Section 10.1 Service provider not offered opportunity to resolve | 1,336 |
| Section 10.2(b) Matter previously or currently with another agency | 1,258 |
| Section 10.3(a) Facts transpired more than one year ago | 1,539 |
| Section 10.3(b) Facts arose prior to effective date | 53 |
| Total | 4,186 |
The only increase was in complaints that customers tried to file in which facts took place more than one year earlier, which showed a 13.4% increase over last year.
Although complaints about a service provider’s failure to accommodate customer accessibility requests are out of our mandate, at the request of the CRTC and members of the accessibility community, we track when customers raised accessibility issues about their service providers. We also refer these issues to the proper organization, the CRTC.
| Section | Number |
|---|---|
| Contract not provided in alternative format | 1 |
| Policies and operating procedures | 17 |
| Customer was refused an accessibility plan | 2 |
| Customer service: Indifference to customer’s disability | 36 |
| Emergency services | 2 |
| Hearing and speech issues: Lack of in-store language accessibility MRS not available VRS not available Total |
2 2 2 6 |
| Visual issues: Bills and other information not provided in alternative format | 10 |
| Mobility issues: Lack of in-store physical accessibility | 0 |
| Special type of wireless device handset not offered | 3 |
| TV accessibility issues | 57 |
| Other issues | 9 |
| Total | 143 |
Complaints about TV accessibility issues decreased substantially, from 105 last year to 57 this year.
Small business
In 2019-20, we had 1,182 complaints from small business customers, 7.4% of all concluded complaints.
When we report our operational statistics, we include the data for all the complaints we dealt with during the year. However, not all complaints are alike. In particular, we know that complaints from small business customers can be quite different from those of individual consumers. The following tables highlight the differences.
The small business percentages are similar to last year’s results.
Unlike the previous two years, when internet access services had the most complaints, this year wireless services had the most, up from 30.5% last year to almost 36% this year.
| Subject | Small business | Consumer |
|---|---|---|
| Contract dispute | 47.0% | 30.5% |
| Billing | 30.8% | 41.5% |
| Service delivery | 19.6% | 24.2% |
| Credit management | 2.6% | 3.8% |
| Total | 100% | 100% |
| Service | Small business | Consumer |
|---|---|---|
| Internet | 32.3% | 27.0% |
| Local phone | 30.2% | 11.9% |
| Wireless | 36.3% | 45.0% |
| Long distance | 1.2% | 1.2% |
| Issue | Small business | Consumer |
|---|---|---|
| Disclosure issues | 14.0% | 14.1% |
| Incorrect charge | 10.4% | 13.1% |
| Legitimacy of early termination fee (ETF) | 8.7% | 2.5% |
| Intermittent/Inadequate quality of service | 6.4% | 8.6% |
| Breach of contract | 5.8% | 5.5% |
| Credit/refund not received | 4.1% | 5.3% |
| Auto-renewal | 3.6% | 0.0% |
| No consent provided | 3.6% | 1.8% |
| Amount of ETF | 3.5% | 0.9% |
| Material contract change without notice | 2.5% | 2.6% |
Analysis of closed complaints
Our operational statistics show that we closed 1,732 complaints in 2019-20. The following table provides a breakdown of the reasons why those complaints were closed, with reference to the relevant section of the Procedural Code.
| Complaint | Issues | % |
|---|---|---|
| Closed as duplicate | 6 | 0.3% |
| Customer withdraws complaint | 214 | 12.4% |
| Out-of-mandate after further information obtained | 20 | 1.2% |
| Phone consultation | 3 | 0.2% |
| Section 9.1(b) Customer is not authorized to file complaint | 11 | 0.6% |
| Section 9.1(c) Complaint more appropriately handled by another agency | 13 | 0.8% |
| Section 9.1(d) Further investigation not warranted | 422 | 24.4% |
| Section 9.1(e) Customer not cooperative | 740 | 42.7% |
| Section 9.1(f) Service provider offer is reasonable | 182 | 10.5% |
| Section 10.2(b) Matter previously or currently with another agency | 12 | 0.7% |
| Section 10.3(a) Complaint filed outside time limits | 11 | 0.6% |
| Section 10.3(b) Facts arose prior to effective date | 98 | 5.7% |
| Total | 1,732 | 100% |
Compensation analysis
In cases that are resolved as well as in Recommendations and Decisions, customers may receive some form of compensation from their service provider. This compensation can take many forms, including:
- bill credits
- bill adjustments
- free or discounted products and services
- cash payments
We attempt to record the value of all compensation awarded to customers as a result of the CCTS process. This is challenging because in a significant number of cases (in particular, resolutions that occur at our Pre-investigation stage) we are not provided with the details of the settlement reached between the customer and the service provider.
The total compensation awarded was $2,734,058.51.
| Compensation range | Number of complaints | Percentage |
|---|---|---|
| < $100 | 3,584 | 40.0% |
| $100 – $499 | 4,107 | 45.8% |
| $500 – $999 | 798 | 8.9% |
| $1,000 – $4,999 | 451 | 5.0% |
| $5,000 or more | 25 | 0.3% |
| Total | 8,965 | 100% |
“I was getting nowhere with my provider but saw immediate action when the CCTS got involved.”
Performance standards
Each year, we set ourselves a goal of great customer service. To ensure that we’re meeting that goal, we track our performance across various benchmarks.
Contact Centre/Pre-investigation
| Process | Target | Results |
|---|---|---|
| Answer phone calls within 120 seconds | 80% | 87.7% |
| Process written communications within 3 calendar days | 80% | 97.3% |
Complaint handling
| Process | Target | Results |
|---|---|---|
| Complaints concluded at Pre-Investigation stage within 40 days of acceptance | 80% | 95.1% |
| Complaints concluded at Investigation stage within 60 days of referral to Investigation | 80% | 89.3% |
We far exceeded all of our target benchmarks.
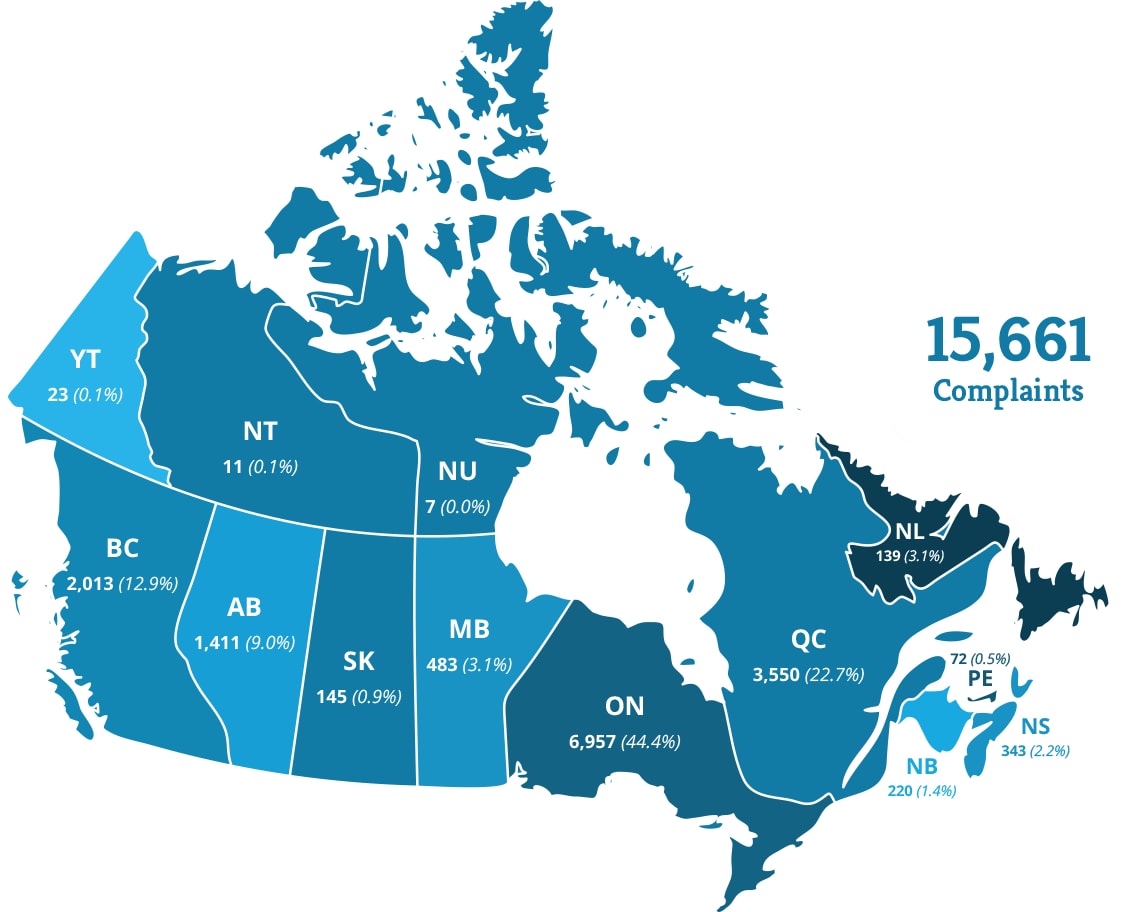
Regional analysis
We receive complaints from customers throughout Canada. Here, we identify the number of accepted complaints by province/territory.
* Canada, Statistics Canada, Table 17-10-0009-01 (formerly, CANSIM 051-0005)
| Province | Complaints | Population | |||
|---|---|---|---|---|---|
| Alberta | 1,411 | 9.0% | 4,428,247 | 11.7% | |
| British Columbia | 2,013 | 12.9% | 5,120,184 | 13.5% | |
| Manitoba | 483 | 3.1% | 1,379,121 | 3.6% | |
| New Brunswick | 220 | 1.4% | 780,890 | 2.1% | |
| Newfoundland and Labrador | 139 | 0.9% | 520,437 | 1.4% | |
| Northwest Territories | 6 | 0.0% | 44,982 | 0.1% | |
| Nova Scotia | 343 | 2.2% | 978,274 | 2.6% | |
| Nunavut | 7 | 0.0% | 39,486 | 0.1% | |
| Ontario | 6,957 | 44.4% | 17,745,040 | 38.8% | |
| Prince Edward Island | 72 | 0.5% | 158,717 | 0.4% | |
| Quebec | 3,550 | 22.7% | 8,552,362 | 22.5% | |
| Saskatchewan | 145 | 0.9% | 1,181,987 | 3.1% | |
| Yukon | 23 | 0.1% | 41,293 | 0.1% | |
| Not specified | 292 | 1.9% | |||
| Total | 15,661 | 100% | 37,971,020 | 100% | |