Annual Report

August 1, 2022 – July 31, 2023

Table of Contents

Chair’s Message

Annual Report

August 1, 2022 – July 31, 2023

Last year, we celebrated the 15th anniversary of the CCTS, and I am pleased to highlight the remarkable achievements that have shaped our organization during the year.

A standout achievement was the highly anticipated implementation of our service delivery project, a comprehensive initiative which incorporated significant process and technology enhancements. It entailed extensive research, stakeholder consultations, and planning. It represents the beginning of a new era of operations for the CCTS. These improvements better equip the CCTS to address complaints promptly and to provide effective complaint resolution.

The Board’s significant contributions and oversight have guided our service delivery transformation and ensured its ongoing success. On behalf of the Board, I extend our heartfelt appreciation to the CCTS leadership, staff, and stakeholders who have contributed to the vision and implementation of these changes. I commend the team at the CCTS for its leadership in executing a significant project and delivering it on time within the budget.

In February 2023, the Government of Canada finalized its telecommunications policy direction to the CRTC. This policy direction supports strengthening the ability of the CCTS to better fulfill its mandate. This confirms the importance of consumers’ right to redress and affirms the important role that the CCTS plays for telecommunications consumers. As we look ahead, we will continue our work so that Canadians are aware of the CCTS and their right of recourse to it. Activities aimed at increasing public awareness will be a cornerstone of our future endeavours. Our ongoing collaboration with diverse stakeholders provides us with invaluable insights, which will enhance our ability to do this work effectively.

This year also included a change to our Board of Directors. In November of 2022, our Independent Director, Darlene Halwas, CFA, ICD.D, retired from the Board. I want to thank Darlene for her six years of dedicated service. I also want to welcome the newly elected director, Patricia A. Kiley, CPA, C.A., ICD.D, who assumed this role in November.

As we reflect on this remarkable year and celebrate the 15th anniversary of the CCTS, it is important to acknowledge the dedication of our exceptional team. They have remained committed to delivering outstanding dispute-resolution services and ensuring that Canadian consumers receive the support they deserve. We extend our deepest appreciation to our staff for their enthusiasm and dedication.

Sincerely,

Catherine Aczel Boivie
Chair of the Board, CCTS

Signature

Commissioner’s Message

Annual Report

August 1, 2022 – July 31, 2023

This past year marked a significant milestone for the CCTS as we celebrated our 15th anniversary. It was a year filled with remarkable achievements and transformative initiatives, as we continued to enhance our services to further help Canadian consumers and their service providers work together to resolve their disputes.

One of the highlights of 2022-23 was the launch of our revised complaint-handling process and modernized technology. This represented the most significant transformation in our history. The ultimate objective of this evolutionary program is to provide more efficient and effective resolution of complaints and improved data on industry issues. Our new process also increases transparency and provides improved value to our stakeholders. These changes were made following a review by internationally renowned experts and extensive consultations with our stakeholders, including consumer groups and service providers.

This past year, the CCTS enhanced several initiatives to improve stakeholder engagement, including our consultations with the Consumer Advisory Panel and groups representing Canadians with disabilities. These panels played a pivotal role in facilitating discussions about the needs of consumers who are vulnerable, disadvantaged, or hard to reach. We will use what we have learned in these consultations to achieve one of our key strategic objectives to develop better ways to increase the public’s awareness of the CCTS. We will begin to implement new initiatives in 2023 and 2024 to ensure that we meet this objective.

I am proud to confirm that, once again this year, we successfully resolved nearly 90% of complaints. Many were resolved at the early stages of our processes, even amidst this busy period of significant change. Our team’s dedication to fair treatment and accountability remains constant. These case summaries serve as testimonials to the invaluable work the staff at the CCTS undertakes each day.

It has been a year of remarkable progress, innovation, and collaboration for the CCTS. With our service delivery modernization, stakeholder engagement initiatives, and commitment to increasing public awareness about our service, we continue to deliver fair and impartial dispute resolution and improved consumer experiences. We look forward to the future with enthusiasm. We are confident in our ability to evolve as we strive for excellence in all our endeavours.

Thank you to all my colleagues for their prodigious efforts and unwavering commitment. To our Board of Directors, thank you for your continued contributions and steadfast support, without which this transformation project could not have taken place.

Sincerely,

Howard Maker
Commissioner & CEO, CCTS

Signature

Year at a Glance

Annual Report

August 1, 2022 – July 31, 2023

This section provides an overview of significant events and data points for the CCTS between August 1, 2022, and July 31, 2023.

By the numbers

Successful resolutions

89% of concluded complaints were successfully resolved.

Complaints up

14,617 in-mandate complaints were accepted, up 14% from last year.

Top issues

While billing issues were the number one issue for wireless services and TV services, service delivery issues were the top issue for internet and local phone customers.

Industry-wide participation

441 brands operated by 315 service providers participated in the CCTS.

Distribution of complaints

86% of complaints were filed about 10 service providers.
259 brands had zero complaints.
99 brands had 3 complaints or fewer.

Conciliation or investigation required

17% of concluded complaints required an conciliation or investigation.

Total issues

28,821 issues were raised in 13,847 concluded complaints.

Key events

  • We celebrated 15 years of serving Canadians with a campaign to boost public awareness about our services. Our digital campaign included improved search engine optimization, and social media efforts to engage new audiences. This expanded our online reach. Over the past 15 years, we have helped customers and service providers resolve almost 175,000 complaints!
  • We launched our new service delivery modernization project. This included:

    These changes were the result of extensive consultations with stakeholders about business process changes related to our service delivery review project and our new complaint-handling system.

  • We continued consulting a diverse set of civil society, consumer, and accessibility groups across Canada, including:
    • nine accessibility groups who helped us to better understand diverse accessibility needs; and,
    • two meetings with the CCTS Consumer Advisory Panel which included nine consumer groups. They offered a wide range of views and perspectives to inform efforts to continuously improve our service delivery and to increase public awareness.
  • We continue to expand the availability of our service to more Canadians, as we welcomed 23 new service providers to the CCTS.
  • We increased our engagement with non-compliant Participating Service Providers (PSPs). This resulted in improved compliance with our complaint-handling processes and their obligations to promote public awareness about the CCTS.
  • We terminated the participation of ICA Micro-Systems Inc. (ICA) for not complying with participation requirements. They had failed to implement a CCTS-issued Decision[1] ICA has since re-joined the CCTS after rectifying all issues of non-compliance.
  • We appeared before the House of Commons Industry Committee studying Bill C-288. The bill would require internet service providers to give consumers more transparent and accurate information about broadband services. We discussed our mandate and how we help customers with complaints about quality of internet service issues.

Who We Are and What We Do

Annual Report

August 1, 2022 – July 31, 2023

Our mandate

The CCTS is a national, independent organization dedicated to working with customers and service providers to resolve complaints about telecommunication and television services. Our structure and mandate are overseen by the Canadian Radio-television and Telecommunications Commission (CRTC).

We work with individual customers, small business customers, and participating service providers to resolve disputes with their telecommunications and TV service providers after efforts between them directly have been unsuccessful.

We can help with most types of problems between a customer and a service provider. These include disputes about:

  • contracts,
  • billing,
  • service delivery, and
  • credit management.

Services in our mandate: 1. Internet 2. Wireless, including voice, data and text 3. TV, for residential customers only 4. Phone, for home and small business, including long distance, white page directories, directory assistance and operator services

Overview of who we are and what we do

“I just wanted to take a moment to express my gratitude for the exceptional support you have provided me. Your quick and thorough responses to my inquiries have been invaluable in helping me navigate and resolve issues. Thank you CCTS!”

Customer who used the CCTS’ services

Strategic priority to improve our service delivery model and workflow

Our first strategic priority is to deliver efficient, effective, and transparent service to customers and service providers. While the CCTS has always worked to continuously improve our services, we began a comprehensive review of our service delivery in 2019 to plan and resource transformative changes and strengthen our culture of continuous improvement.

In May 2023, we launched our updated complaint-handling process and new complaint-management system. These initiatives were the result of years of consulting stakeholders, reviewing our end-to-end business process, and significant planning and development work.

The redesigned process and technology transformation aims to:

  • deliver an even more efficient, effective, and transparent service to customers and service providers;
  • build a deeper value-added relationship with our stakeholders;
  • address pain points our stakeholders raised; and,
  • strike the right balance between the various stakeholder needs.

Our updated complaint-handling process, effective May 23, 2023

Our top priority continues to be ensuring a responsive dispute resolution process that offers customers and service providers outcomes that are fair, timely, and impartial.

Our simplified complaint-handling process is designed to help customers and service providers resolve their issues faster. It also helps them better understand how we make decisions about the complaint.

The main objectives of our process remain the same. The changes aim to streamline and simplify the process:

  • We launched an updated complaint form that uses plain language to make it more customer-friendly. The improved form provides customers with more information and guidance. This will help customers include the right information when they submit a complaint. In turn, this helps us to process their complaints more quickly.
  • The scope of our mandate remains the same. The types of complaints we can and cannot accept has not changed.
  • Our complaint-handling process continues to seek quick and efficient resolutions that satisfy both the customer and the service provider during Initial Referral – the first stage of the process. The time allotted to service providers to respond to the CCTS about their customer’s complaint has been reduced. This will help us to resolve complaints faster.
  • Service providers must continue to submit all relevant documents to the CCTS when a complaint remains unresolved.
  • We have introduced a new Conciliation stage into our process. Previously, complaints were informally resolved and investigated at the Investigation stage. In the new Conciliation stage, we will informally mediate and explore possible solutions, without going to the time and expense of conducting a full investigation, where it may not be necessary. Ideally our efforts at this stage will lead to more complaints being resolved sooner.
  • Where we cannot resolve a complaint informally, we conduct a thorough investigation, following which we now issue Investigation Findings. This document explains whether a service provider met its obligations according to its contract, policies, operating procedures, and regulatory requirements, and, if not, how it must fix the problem. Previously, we issued a Recommendation if we found that the service provider did not meet its obligations. We closed the complaint if they did, or if their proposal to correct the issue was reasonable. Now, all Investigations result in written Investigation Findings, regardless of whether we find a provider has met its obligations or not. This makes our complaint-handling and decision-making rationale more transparent.
  • In the new process, customers and service providers can request a Case Review if they believe we made an error of fact or interpretation and that our error affected the Investigation Findings. If it seems more likely than not that we made such an error, we conduct a Case Review. Then, we issue confirmed or amended Investigation Findings.
  • We continue to have the same authority to require service providers to fix the issue when their provider has not met its obligations. We can require a provider to explain or apologize for the problem, correct the problem, or reimburse the customer for proven financial losses.
  • Service providers must continue to implement all resolutions and remedies in Investigation Findings that the customer has accepted.

On May 23, 2023, we began handling all complaints using our new process. This process came into effect with an updated Procedural Code. The Code sets out the framework for how we accept, investigate, and resolve complaints.

The CCTS reports on complaints concluded between August 1 and July 31 of every year. Therefore, reporting about complaints in this year’s annual report includes:

  1. Complaints concluded before May 23, 2023, under the old process:
    • Pre-Investigation,
    • Investigation,
    • Recommendation, and
    • Decision; and
  1. Complaints concluded after May 23, 2023, under the new process:
    • Initial Referral,
    • Conciliation,
    • Investigation, and
    • Case Review.

Find out more about our updated process, click on Complaint Process Explained.

2022-23 Complaints

Annual Report

August 1, 2022 – July 31, 2023

This section provides a broad overview of the complaint data for this fiscal year. Additional detailed analysis follows throughout the report. For definitions of the terms used in this section, see the Glossary of Terms.

About our data

We report on the complaints we accepted and concluded within our fiscal year, August 1, 2022 and July 31, 2023. The complaints we received, investigated and/or concluded after July 31, 2023 will be reported in next year’s Annual Report.

Due to the timing of the implementation of the service delivery transformation project, this year’s report includes:

  1. complaints concluded before May 23, 2023 under the old process stages:
    Pre-Investigation, Investigation, Recommendation, and Decision, and
  2. complaints concluded after May 23, 2023 under the new process stages:
    Initial Referral, Conciliation, Investigation, and Case Review.

NOTE: A single complaint may raise more than one issue. As part of our transformation process, we reviewed and simplified our “nature of incident” classification system. Reporting on issues this year is based on the new classification system. Refer to Appendix D, which provides the new issue structure and maps the old names to the new names.

To ensure the accuracy of the statistics we report, we audit the data throughout the year. Percentages are commonly rounded when presented in tables. As a result, the sum of the individual numbers does not always add up to 100%.

Complaint statistics

Table 5.1: Summary of complaint statistics

Note: Complaints that were closed before May 23, 2023 are reported to the appropriate stage in the new process stages.

* As of May 23, 2023, as part of our complaint-handling process update, the CCTS introduced a new Conciliation stage. For this reason, there is no comparative year-over-year data.


Between August 1st, 2022, and May 22nd, 2023, the CCTS issued three Recommendations accepted by both the customer and service provider, and one Decision. As of May 23, 2023, the CCTS changed its process, and it no longer issues Recommendations and Decisions. To find out more about our new process, visit Who we are and what we do.

Table 5.2: Leading complaint issues broken down by service type

* The number of issues is higher than the number of complaints accepted because a single complaint may raise more than one issue.

† Other services include long-distance and operator-services issues. There were no complaints about directory assistance or white-pages directories in 2022-23.

** The Other complaint category includes in-scope accessibility-related issues.


Wireless services generated the largest number of complaint issues, including the most in each category of issues: billing, contract dispute, service delivery, and credit management. For the second year in a row, there were more wireless service delivery issues than internet service delivery issues.

Billing issues were raised most often in wireless and TV complaints. Service delivery concerns were raised most often by internet and local phone customers.

Overall, the number of billing issues remained steady. Service delivery issues increased across all service types (wireless, internet, TV, and local phone) from last year. Overall, there was a decrease in issues raised about contract disputes and credit management for all service types.

Reporting on CRTC Codes of Conduct

Annual Report

August 1, 2022 – July 31, 2023

When the CCTS investigates customer complaints about telecom and TV services, we try to determine if the service provider has reasonably met its responsibilities to the customer.

Overview of CRTC codes of conduct

We use four mandatory CRTC codes of conduct as yardsticks against which we measure service provider conduct:

  • Wireless Code: For consumer and small business customersA small business customer is a business whose average monthly telecommunications bill is under $2,500. Corporate and commercial accounts are not small business customers. of mobile wireless services.
  • Internet Code: For all retail fixed internet access services, including cable, fibre, digital subscriber line (DSL), fixed wireless, and satellite services provided by Canada’s 10 largest internet service providers, their brands, and affiliates. Mobile wireless internet services are covered by the Wireless Code.
  • Television Service Provider (TVSP) Code: For residential subscription TV services.
  • Deposit & Disconnection (D&D) Code: For residential home phone services.

To learn about how we administer the CRTC codes of conduct, watch the video below.

For more detailed information about the preceding codes, see:

Resolving complaints and analyzing code compliance

When we accept a customer complaint, we record and track all the issues raised in the complaint. Some complaints raise questions about whether a provider has complied with a code of conduct. We call these “alleged breaches.”

The vast majority of complaints are resolved to the satisfaction of the customer and the provider during the initial stages of our process. When complaints are resolved, there is no need for us to investigate the underlying issues, including to determine if there have been any violations of a code of conduct. Therefore, these issues remain characterized as “alleged breaches” and are categorized as “not requiring investigation” in the following figures.

In the cases that we do investigate, we can determine whether there has been a code violation. We categorize proven violations as “confirmed breaches.” When we investigate and determine that there has not been a violation, we categorize this as “no breach.”

In this section, we present statistical reports on breaches of the four applicable codes using the preceding terminology.

Wireless Code

The Wireless Code seeks to ensure that consumers of voice and data services are better informed of the rights and obligations contained in their contracts. The Wireless Code makes it easier for individuals and small business customers to understand their wireless service contracts, to prevent bill shock from extra data charges and roaming charges, and to make it easier for Canadians to switch wireless providers.

The Wireless Code applies to individual and small business customers. All wireless service providers must follow its guidelines.

Figure 6.1: Summary of Wireless Code breaches

From 891 alleged breaches, 788 alleged breaches did not require investigation and 103 breaches were investigated. Out of the 103 breaches investigated, 48 breaches were confirmed and 55 were not confirmed as a breach.

Table 6.1: Wireless Code confirmed breaches by section

Note: In charts throughout this report, year-over-year increases are shown in green, and year-over-year decrease are shown in red.


There were 48 confirmed breaches of the Wireless Code, a decrease of 26% from last year.

Disconnection (Section I) continued to be the most breached requirement of the Wireless Code, accounting for 42% of all confirmed breaches this year (up from 29% last year). Almost all the confirmed breaches are because the service provider did not give the required amount of notice or provide all the required information in the notice.

Problems with the information in or the provision of contracts and related documents (Section B) and the Critical Information Summary (Section C) accounted for 35% of all confirmed breaches (down from 43% last year).

There were two confirmed breaches of failure to communicate with customers in a way that is clear, timely, or accurate (Section A, Clarity) this year, compared to eight last year. We also confirmed three breaches related to unlocking problems (Section F, Mobile device issues), which increased from zero last year.

Table 6.2: Wireless Code confirmed breaches by service provider

Virgin Plus and Shaw saw an increase in confirmed breaches of the Wireless Code this year while the overall number of confirmed breaches of the Wireless Code decreased. Virgin Plus had the largest proportion of confirmed breaches (27%).

Rogers and Freedom Mobile saw a significant decrease in confirmed Wireless Code breaches this year. Rogers had two confirmed breaches this year, compared to seven last year. It now accounts for 4% of all confirmed Wireless Code breaches, compared to 11% last year. Freedom Mobile had four confirmed breaches this year, compared to 12 last year. It now accounts for 8% of all confirmed breaches, compared to 18% last year.

Internet Code

The Internet Code was created so that customers of fixed internet access services are better informed about rights and responsibilities contained in their contracts with internet service providers (ISPs). The Internet Code is intended to make it easier for individual customers to understand their internet service contracts, to prevent bill shock from overage fees and price increases, and to make it easier for Canadians to switch internet service providers.

The Internet Code applies only to individual customers; it does not apply to small business customers.

The Internet Code applies to large facilities-based ISPs and their brands and affiliates, which are listed in Table 6.3. However, when we investigate a complaint about an ISP to which the Internet Code does not apply, we may use the principles of the Code to guide us in determining what is good industry practice.

Figure 6.2: Summary of Internet Code breaches

From 195 alleged breaches, 170 alleged breaches did not require investigation and 25 breaches were investigated. Out of the 25 breaches investigated, 8 breaches were confirmed and 17 were not confirmed as a breach.

There were eight confirmed breaches of the Internet Code this year, down from 22 last year.

The top confirmed breach areas were related to:

  • changes to contracts and related documents (Section D) with three confirmed breaches (38% of all Internet Code breaches), and
  • disconnection (Section I) with three confirmed breaches (38% of all confirmed Internet Code breaches).

These breaches account for 75% of all confirmed Internet Code breaches.

Table 6.3: Service providers governed by the Internet Code
Large facilities-based ISPs Related brands and affiliates
Bell Canada
  • Acanac Inc.
  • Bell Aliant
  • Bell MTS
  • Cablevision (Cablevision du Nord)
  • Téléphone de Saint-Victor
  • Distributel
  • DMTS (Dryden Municipal Telephone System)
  • EBOX
  • KMTS (Kenora Municipal Telephone System)
  • Maskatel
  • Northern Tel
  • Northwestel*
  • Ontera
  • Primus
  • Télébec
  • Téléphone de Saint-Éphrem
  • Virgin Plus
  • Télécommunications Xittel
Cogeco Connexion Inc. (Ontario and Quebec)
  • Oxio
Eastlink
  • Amtelecom Limited Partnership
  • Coast Cable
  • Delta Cable
  • K-Right Communications Inc.
  • People’s Tel LP
  • Persona Communications Inc.
Rogers
  • Cable Cable Inc.
  • Compton Communications
  • Cross Country T.V. Limited
  • Fido
  • Kincardine Group
  • KWIC Internet
  • RuralWave
  • Seaside Communications Powered by Rogers
  • Seaside Wireless Communications Powered by Rogers
  • Shaw Communications
  • Source Cable
Sasktel
  • maxTV
TELUS
  • ABC Communications
  • Altima Telecom
  • GTA Telecom
  • Mascon Cable
  • start.ca
Videotron Ltd.
  • Fizz
  • Freedom Mobile Inc.
  • VMedia
Xplore
  • MetroLoop

NOTE: This list is based on the information PSPs provide to the CCTS and is subject to change.

* Northwestel’s terrestrial retail internet services are regulated by the CRTC; therefore, customers should forward their complaint to the CRTC. However, Northwestel’s satellite retail Internet services are not regulated by the CRTC, so the CCTS can accept complaints about these services.

Table 6.4: Internet Code confirmed breaches by service provider


TELUS continues to account for the largest proportion of all confirmed Internet Code breaches with three (38% of all confirmed breaches), down from 11 last year. All of TELUS’ confirmed breaches were due to failure to provide the customer with 30 days’ notice before making changes to other contract terms and conditions or related documents during the commitment period (Section D).

Rogers had two confirmed Internet Code breaches, the same as last year. Virgin Plus had one confirmed Internet Code breach, down from two last year. Cogeco had two confirmed Internet Code breaches compared to zero last year.

Television Service Provider Code

The Television Service Provider Code (TVSP Code) is intended to make it easier for Canadians to understand their television service agreements and to empower residential customers in their relationships with TVSPs.

The TVSP Code applies to consumers. It does not apply to small businesses. All licensed TV service providers must follow its requirements. We address complaints about subscription TV services provided by cable, Internet Protocol television (IPTV), and national satellite direct-to-home (DTH) TV service providers.

Figure 6.3: Summary of TVSP Code breaches

From 55 alleged breaches, 40 alleged breaches did not require investigation and 15 breaches were investigated. Out of the 15 breaches investigated, 14 breaches were confirmed and 1 was not confirmed as a breach.

There were 14 confirmed breaches of the TVSP Code this year, up from nine last year. The vast majority of the confirmed breaches were about changes to programming options (Section X). These 12 confirmed breaches accounted for 93% of all confirmed breaches and increased from one breach for this requirement last year. The remaining breaches were about clarity of offers (Section II) and changes to the customer’s contract without notice (Section XI).

Table 6.5: TVSP Code confirmed breaches by service provider


TELUS had 13 confirmed TVSP Code breaches this year, compared to three breaches last year. This represents 93% of all confirmed TVSP Code breaches. Twelve of TELUS’ confirmed breaches were the result of the service provider’s failure to provide the customer with a written summary of the changes the customer made to their individual or discretionary channels (Section X, Changing programming options).

Cogeco had one confirmed TVSP Code breach this year, compared to zero last year.

Deposit and Disconnection Code

The Deposit and Disconnection Code (D&D Code) provides protection to local phone customers in situations where they are required to provide a deposit as a condition of obtaining local phone service or when a service provider intends to disconnect the customer’s local phone service.

There was one confirmed breach of the D&D Code this year, down from two last year. The breach was related to the service provider’s failure to restore service that was suspended in error, during business hours the next working day (Section 3.5).

Figure 6.4: Summary of D&D Code breaches

From 19 alleged breaches, 18 alleged breaches did not require investigation and 1 breach was investigated. Out of the 1 breach investigated, 1 breach was confirmed and 0 were not confirmed as a breach.

Table 6.6: Deposit and Disconnection Code confirmed breaches by service provider


The one confirmed breach of the D&D Code this year was from iTalkBB, up from zero last year.

Topics and Trends

Annual Report

August 1, 2022 – July 31, 2023

In 2022-23, we accepted 14,617 complaints filed by customers across Canada. This represents a 14% increase from last year.

Overview

During this year of transformation, we successfully maintained a high-resolution rate of 89%.

We resolved 75% of all complaints within 30 days.

Issues raised in complaints

This year, 28,821 issues were raised in 13,847 concluded complaints. A single complaint can contain multiple issues. For example, a customer may submit one complaint about both the billing of their internet service and roaming charges related to their wireless service, which would be reported as two issues.

Wireless issues remain the most-raised issue, representing 55% of all issues raised. Wireless issues increased by 6% compared to last year. Internet issues returned to the second most-raised issue, accounting for 26% of all issues raised.

As part of our transformation process, we reviewed and simplified our “nature of incident” classification system. Reporting on issues this year is based on the new classification system. Refer to Appendix D, which provides mapping of old issue names to new issue names.

Table 7.1: Number of issues by service type, Year-over-Year (YOY) change

Figure 7.1: Five-year view of issues by service type

Spotlight on wireless services

  • Wireless remains the most complained-about service. Wireless issues increased by 6% from last year.
  • Wireless issues account for 55% of all issues raised, up from 51% last year.
  • Billing remains the top category of issues for wireless services, representing 44% of wireless issues. Wireless billing issues increased by 11%.
  • Contract dispute issues, and service delivery categories followed, comprising 30% and 22% of wireless complaint issues, respectively.
  • Disclosure issues remain a top issue raised by wireless customers. Disclosure issues account for 18% of all wireless issues, up from 15% last year. Wireless disclosure issues decreased by 2% from last year.
  • Notably, wireless complete loss of service issues increased by 93%.
  • Issues relating to wireless roaming charges also increased by 98%.
Figure 7.2: Five-year view of wireless issues
Table 7.2: Top 10 wireless issues
Issue Number Proportion YoY (%)
Disclosure issues 2,839 18% -2%
Monthly price plan – Incorrect charge 2,170 14% 16%
Quality of service 1,152 7% 8%
Credit or refund not received 1,019 6% 31%
Roaming charges 851 5% 98%
Changes to the contract 784 5% 32%
Breach of contract 756 5% -16%
3rd party credit reporting 650 4% -12%
Due dates not kept or delay for installation or cancellation of service 554 3% 8%
Complete loss of service 487 3% 93%
Figure 7.3: Five-year view of internet issues


Spotlight on internet services

  • Internet issues account for 26% of all issues raised by customers.
  • Internet issues declined by 7% and this is the second year in a row that internet issues declined.
  • Service delivery is the top category of issues for internet services, representing 41% of all internet issues.
  • Despite a decrease in overall internet issues, internet service delivery issues increased by 5%. This increase is driven by significant increases in issues related to complete loss of service, a 48% increase, and unable to cancel, a 72% increase. Meanwhile, the top service delivery issue continues to be quality of service, which decreased by 13% and accounts for 16% of internet issues.
  • Billing continues to be the second most-raised category of issue, accounting for 33% of all internet service issues.
Table 7.3: Top 10 internet issues
Issue Number Proportion YoY (%)
Quality of service 1,183 16% -13%
Monthly price plan – Incorrect charge 922 12% -9%
Disclosure issues 766 10% -13%
Due dates not kept or delay for installation or cancellation of service 621 8% -3%
Complete loss of service 554 8% 48%
Credit or refund not received 479 7% 18%
Changes to the contract 301 4% 11%
Termination fee 271 4% -30%
Breach of contract 266 4% -28%
Unable to cancel 253 3% 72%

Spotlight on TV services

  • For the fourth consecutive year, the number of TV issues decreased.
  • TV issues account for 10% of all issues raised in 2022-23.
  • Although down in overall complaints, billing remains the top category of issues raised by customers of TV services, representing 39% of all issues about TV services.
    • Incorrect charge relating to the monthly price plan remains the top billing issue for TV customers, accounting for 14% of TV issues.
  • Service delivery is the second most-raised category of issues by TV customers, accounting for 35% of TV issues.
    • Quality of service is the top service delivery issue, accounting for 14% of all TV issues, a 3% increase from last year.
    • Complete loss of service issues increased by 33% since last year.
Figure 7.4: Five-year view of TV issues
Table 7.4: Top 10 TV issues
Issue Number Proportion YoY (%)
Monthly price plan – Incorrect charge 417 14% -17%
Quality of service 390 13% 3%
Disclosure issues 346 12% -24%
Due dates not kept or delay for installation or cancellation of service 210 7% -9%
Complete loss of service 173 6% 33%
Credit or refund not received 168 6% -7%
Changes to the contract
150 5% -11%
Equipment charges 98 3% -37%
3rd party credit reporting 97 3% -22%
Breach of contract 94 3% -24%
Figure 7.5: Five-year view of phone issues

Spotlight on phone services

  • Local phone services (landlines) account for 9% of all issues and are down 17% from last year. Phone issues have decreased consistently for four years in a row.
  • Service delivery remains the top category of issues, accounting for 43% of all issues raised about local phone services.
    • Quality of service was the second most-raised issue by local phone customers, accounting for 12% of local phone issues. Phone quality of service issues decreased by 4% from last year.
  • Billing remains the second most-raised category of issues.
    • Notably, issues related to incorrect charge relating to monthly price plan remains the top issue for phone customers accounting for 12% of local phone issues.
    • Issues related to complete loss of service were the most-increased local phone issue, up 20% from last year.
Table 7.5: Top 10 phone issues
Issue Number Proportion YoY (%)
Monthly price plan – Incorrect charge 313 12% -22%
Quality of service 301 12% -4%
Disclosure issues 249 10% -22%
Complete loss of service 231 9% 20%
Due dates not kept or delay for installation or cancellation of service 178 7% -18%
Unable to port 145 6% 4%
Termination fee 114 5% -42%
Credit or refund not received 114 5% -12%
Changes to the contract 106 4% -12%
Regular price increase of monthly price plans 73 3% 3%

Breakdown of issues across all service types

Disclosure issues continue to be the top issues raised by all customers, followed by complaints about incorrect billing of their monthly price plans.

Table 7.6: Top 10 issues across all service types

Contract dispute issues

Disclosure issues

Customers often raise concerns about information not being fully or clearly provided. This is reflected in the data, as disclosure issues continue to be the top issue. Disclosure issues were raised 4,222 times this year across all service types and account for 15% of all issues raised across all service types. Disclosure issues decreased for the third year in a row and decreased by 8% from last year.

Figure 7.6: Five-year view of disclosure issues

Note: As part of our transformation process, we reviewed and simplified the nature of incident classification system. Reporting on issues this year is based on the updated classification system.

Disclosure issues by type of service

The lack of clear disclosure is the top issue raised by wireless customers and is the number three issue for internet, TV, and phone customers.

Disclosure issues are raised disproportionately by wireless customers. Although wireless customers account for 55% of all issues raised, they account for 67% of disclosure issues.

Figure 7.7: Disclosure issues by type of service


Table 7.7: Disclosure issues – Top 10 service providers

* The average disclosure resolution rate was 89%.


The top disclosure issue is no consent or contract conflicts with agreement, which occurs when a customer is not made aware that they were entering into an agreement with a provider, or there is a conflict or mismatch between what a customer has agreed to purchase and what their contract indicates. This type of disclosure issue accounts for 78% of disclosure issues, up from 76% last year.

The second biggest disclosure issue is rules related to agreement being unclear, which is about a conflict or a mismatch in the customer’s understanding of the rules related to the agreement, such as information about promotion details not fully disclosed, plan eligibility requirements not disclosed, or details about manufacturer’s warranty or extended warranty coverage not clearly disclosed. This type of disclosure issue accounts for 17% of all disclosure issues. This issue decreased by 5% from last year.


Table 7.8: Types of disclosure issues, broken down by service type


No consent or contract conflicts with agreement

Of all disclosure issues raised, 78% are the result of a conflict or mismatch between whether the customer consented to the agreement, or what the customer believes they agreed to purchase and what is indicated in the contract sent to them after the transaction occurred.

This type of disclosure issue was raised 3,295 times.

Figure 7.8: No consent or contract conflicts with agreement issues by type of service
Table 7.9: Disclosure – No consent or contract conflicts with agreement: Top 3 service providers
Service provider Number of times issue was raised Proportion of issue
Rogers 681 21%
Bell 535 16%
TELUS 499 15%

Rules related to agreement are unclear

A common disclosure issue occurs when the rules related to agreement are unclear. This issue accounts for 17% of all disclosure issues.

Wireless customers raised a disproportionately high number of issues regarding the clarity of agreement-related rules.

Figure 7.9: Rules related to agreement are unclear issues by type of service
Table 7.10: Disclosure – Rules related to agreement are unclear: Top 3 service providers
Service provider Number of times issue was raised Proportion of issue
Rogers 165 24%
Fido 132 19%
Bell 86 12%

Device financing plans

In March 2021, the CRTC issued a decision determining that device financing plans fall under the scope of the Wireless Code. The CRTC found that the required repayment of the balance of a device financing plan ultimately constitutes an early cancellation fee for the purposes of the Wireless Code. To inform future reviews of the Wireless Code, the CRTC requested that the CCTS begin tracking complaints related to device financing plans in our Annual and Mid-Year Reports.

Overall, there was a 31% decrease in device financing plan issues from last year. The proportion of this issue to overall issues raised in 2022-23 is 0.8%, down from 1.2% last year.

Table 7.11: Issues with device financing plans (wireless services)

Key Message: Device Financing Plans

Service providers offer device financing plans to help lower the high cost of wireless devices by spreading the cost into monthly installments over a fixed term. Device financing plans are increasingly complicated, with different components such as a monthly device subsidy, device discounts or device bonuses, and may contain conditions such as a requirement to bring the device back to the provider at the end of the term. While device financing plans are allowed under the Wireless Code, these agreements are complex, and consumers are often surprised at the early cancellation fee or device balance they are required to pay when they cancel before their fixed-term contract is over.

Given the complexity of device financing plans, we continue to encourage providers to explore simpler ways of explaining to customers how their device subsidies work in order to avoid confusion and future complaints. Service providers should also train their representatives to be able to accurately explain cancellation scenarios and the calculation of early cancellation fees if a customer inquires.

We strongly recommend that customers explore cancellation scenarios before entering into an agreement. Asking for an example of how an early cancellation fee would be calculated would be informative. Consumers should also carefully review their device financing plan agreements.

Changes to the contract

Issues regarding changes to the contract occur when a service provider notifies the customer about a change to the terms of their agreement that the customer does not believe the provider is allowed to make, or the provider fails to provide required advance notice to the customer about a change to the terms of their agreement.

This issue accounts for 5% of all issues raised. This past year, issues about changes to the contract increased by 17%. There was a disproportionate increase in changes to contract issues for wireless services. While changes to contract issues for wireless services increased by 32%, overall wireless issues increased by 8%.

This year, 58% of changes to contract issues were raised by wireless customers, up from 51% last year.

Figure 7.10: Changes to the contract issues by type of service
Table 7.12: Changes to the contract issues – Top 3 service providers
Service provider Number of times issue was raised Proportion of issue
Rogers 259 19%
Bell 237 18%
Fido 183 14%

Key Message: Changes to Contract

When there is a dispute about changes to a contract, we ask the provider to demonstrate what the customer agreed to and explain what changes were made to the contract. If changes were made, the provider must also demonstrate that it had the right to make these changes. We also check if the provider followed the appropriate steps to do so, such as providing the required advanced notice or getting the customer’s express consent, if required.

The CRTC codes of conduct set rules about what and how providers can, or cannot, change certain terms of the contract. For example, the Wireless Code requires providers to get the customer’s informed and express consent if it wants to change a “key contract term”. An example of this is when a provider makes changes to the minimum monthly charge during the commitment period. Other contract terms can be changed without customer consent but require notice explaining the change and when it will take effect, at least 30 days prior to the increase taking place.

Breach of contract

Service providers are required to follow their own terms of service, agreements with customers, and any specific offers they have made to a customer. If a service provider fails to follow their contractual requirements, we consider it a breach of contract.

This year contract breaches were the third most-raised contract dispute issue, accounting for 15% of all contract dispute issues and down from 17% last year. Overall complaints about breach of contract decreased by 21% from last year. Of the issues raised, 64% were by wireless customers and 22% by internet customers.

Figure 7.11: Breach of contract issues by service type
Table 7.13: Breach of contract – Top 3 service providers
Service provider Number of times issue was raised Proportion of issue
Rogers 243 20%
Bell 193 16%
Fido 145 12%

Key Message: Breach of Contract

When there is a dispute about a breach of contract, we ask the provider to demonstrate what the customer agreed to and how the service provider acted to fulfill the terms of the agreement. If any changes were made to the agreement, the provider must demonstrate that it had the right to make those changes, and how it followed the rules to do so, such as providing advance notice.

We look at the contract term in dispute and evidence about interactions between the customer and the service provider discussing these terms, such as call recordings, transcripts of chats or calls, and call notes.

Billing issues

Billing issues were raised 11,379 times in 2022-23 and accounted for 39% of all issues raised, maintaining the same percentage as the previous year.


Figure 7.12: Five-year view of billing issues


Complaints about billing issues for wireless services continued to rise, and now account for 60% of billing issues, up from 54% last year.

While overall billing issues decreased by 1% year-over-year, wireless billing issues increased by 11%. This 11% increase is driven by increases to issues about roaming charges (up by 98%), credit or refund not received (up by 19%), pay per use services (up by 139%) and third-party charges (up by 60%).

Figure 7.13: Billing issues by service type
Table 7.14: Billing issues – Top 10 service providers

* The average billing resolution rate was 90%.


Incorrect charges relating to monthly price plans remain the number one billing issue, accounting for 34% of all billing issues. Credit or refund not received is number two, accounting for 16%.

Notably, issues related to roaming charges moved from eighth position to third position in the top ten billing issues. It now accounts for 8% of billing issues, up 4% from last year.

Table 7.15: Top 10 billing issues
Issue Number
Monthly price plan – Incorrect charge 3,856
Credit or refund not received 1,785
Roaming charges 851
Deactivation charges or billed after cancellation 612
Equipment charges 538
Regular price increase of monthly price plans 503
Data charges 411
Installation, activation, or reactivation charges 379
Chargeable messages 338
Invoices not received 327


Incorrect charge relating to monthly price plan

In 2022-23, 34% of all billing issues were about customers being charged incorrectly for their monthly price plans.

Continuing a three-year increase, wireless services account for 56% of incorrect charge issues, up from 50% last year. Wireless customers raised issues about incorrect charges relating to their monthly price plan 16% more often this year.


Figure 7.14: Incorrect charge to monthly price plan by service type
Table 7.16: Incorrect charge to monthly price plan – Top 3 service providers
Service provider Number of times issue was raised Proportion of issue
Rogers 883 23%
Bell 628 16%
TELUS 585 15%

Key Message: Incorrect Charge of a Monthly Price Plan

When we investigate complaints about the incorrect charge of a monthly price plan, we review the rate to which the customer agreed, and we confirm if the billing matches this rate. If there is a mismatch between the bill and the price the customer agreed to, we ask the service provider to explain the reason for this discrepancy. To ensure that the provider is acting reasonably, we also ask why it believes it has the right to bill a different rate.

Billing issues can stem from a lack of clear information, potentially leading to unmet customer expectations or suspicions of being incorrectly charged. We encourage customers to carefully read their agreements. Agreements often provide explanations about what the customer will be billed at the expiry of a fixed-term agreement. They also state whether the customer is required to take any action at the end of their term to adjust their monthly service rate.

Credit or refund not received

Concerns about not receiving a promised credit or refund were the second biggest billing issue.

This issue accounts for 16% of all billing issues, up from 13% last year. The number of times the customers raised issues about credit or refund not being received increased 19% year over year.

While this issue decreased for all other services, wireless services saw a significant 16% increase in this issue compared to last year.

Figure 7.15: Credit or refund not received issues by service type
Table 7.17: Credit or refund not received – Top 3 service providers
Service provider Number of times issue was raised Proportion of issue
Rogers 431 24%
Bell 279 16%
TELUS 266 15%

Roaming charges

Issues with roaming charges increased significantly, by 98%, nearly doubling compared to last year after doubling the year before. This accounts for 8% of billing issues, up from 4% last year. The increase has seen this issue move from eighth position to third position in the top 10 billing issues.

Table 7.18: Roaming charges – Top 3 service providers
Service provider Number of times issue was raised Proportion of issue
Fido 217 26%
TELUS 139 16%
Freedom Mobile 134 16%

Service delivery issues

Service delivery issues increased by 10% from last year despite a 2% decrease in all issues reported. Service delivery issues account for 30% of all issues raised, 8,605 issues raised this year.

Figure 7.16: Five-year view of service delivery issues


Of all service delivery issues raised, 40% were about wireless services. Internet customers account for 35% of service delivery issues, down from 37% last year. However, given that internet customers make up 26% of all issues raised, this is a disproportionately high number of service delivery issues raised by internet customers.

Wireless service delivery issues increased by 18%, which is a disproportionate increase considering overall service delivery issues increased by 10%.

Figure 7.17: Service delivery issues by service type


Rogers now accounts for the most service delivery issues, with 22% of all service delivery issues. Bell ranks second, accounting for 17% and TELUS third, accounting for 12% of service delivery issues.

Notably, TELUS and Fizz experienced a significant increase in service delivery issues this year.

Table 7.19: Service delivery issues – Top 10 service providers

* The average service delivery resolution rate was 87%.


Quality of service issues remain the top service delivery issue. Issues with quality of service account for 35% of all service delivery issues.

Due dates not kept or delayed for installation or cancellation of service is the second most-raised service delivery issue, accounting for 18% of service delivery issues, down from 21% last year.

Complete loss of service is the third-highest service delivery issue. This accounts for 17% of all service delivery issues, up from 12% last year. Complete loss of service is the most-increased service delivery issue, up by 53% from last year.

Table 7.20: Top 10 service delivery issues
Issue Number
Quality of service 3,033
Due dates not kept or delayed for installation or cancellation of service 1,569
Complete loss of service 1,450
Unable to cancel 704
Unable to port 511
Nonpayment or collections 417
Installation error 339
Repair issues and appointments 162
Our of service due to policy 113
Service not working 74

“I felt supported in resolving the dispute with my internet provider. It was quick and done in a professional manner. Thank you for being there!”

Small business owner, Victoria, BC

Quality of service issues

Customers raise quality of service issues when their telecommunications or television services are not working to the service level that they expect. These are some common examples:

  • slower than expected internet or wireless data speeds
  • intermittent service such as service not being continuous, working on and off with regular or irregular interruptions, or
  • call quality issues such as static or clips with their wireless or landline phone service.

Customers raised concerns about the quality of their service 3,033 times this past year. Quality of service remains the number one service delivery issue. This accounts for 35% of all service delivery issues.

For internet customers, quality of service issues continue to be the leading concern, accounting for 16% of all internet issues. Internet customers also account for the highest proportion of quality of service issues at 39%, down from 44% last year.

For wireless customers, quality of service issues account for 38% of all wireless issues reported, up 4% from last year. Wireless quality of service issues increased by 8% this year.

Figure 7.18: Quality of service issues by service type
Table 7.21: Quality of service issues – Top 3 service providers
Service provider Number of times issue was raised Proportion of issue
Rogers 704 23%
Bell 548 18%
TELUS 371 12%

While there was an overall decrease in quality of service issues, Rogers and TELUS both saw a year-over-year increase in the number of issues raised around quality of service, 26% and 35% respectively.

Key Message: Quality of Service

Customers are expected to raise issues with their service providers through appropriate support channels and allow the provider the opportunity to attempt to troubleshoot and resolve the issue. In turn, service providers are expected to act reasonably to address those issues, within the context of their troubleshooting policies.

When we look at complaints about quality of service issues, we determine what the customer ought to be experiencing, for example, through the service provider’s service level commitment or inclusions in the customer’s contract. We also examine the evidence submitted by both the customer and the service provider that shows what service level the customer is actually experiencing. If the customer is not experiencing the expected service quality, we:

  • examine whether the service provider has followed its process to correct the service quality issue or issue credits.
  • consider what other steps the provider has taken to fix the issue and resolve the complaint.

If the customer is not receiving the service levels they ought to experience, the provider will need to correct this or provide appropriate redress to the customer.

Complete loss of service

This past year, complete loss of service represented the most-increased service delivery issue, increasing by 53% from last year. Complete loss of service was the third highest service delivery issue, accounting for 17% of all service delivery issues.

Internet customers reported the highest proportion of complete loss of service issues at 38%. Complete loss of service for internet customers increased by 48% from last year.

Wireless customers account for 34% of complete loss of service issues. Complete loss of service for wireless services increased by 93% from last year.

Figure 7.19: Complete loss of service by service type
Table 7.22: Complete loss of service – Top 3 service providers
Service provider Number of times issue was raised Proportion of issue
Rogers 414 29%
Bell 221 15%
TELUS 133 19%

Rogers accounts for the highest proportion of complete loss of service issues at 29%. Rogers also saw a 138% increase in the number of issues raised about complete loss of service.

Unable to cancel and unable to port services

This year, we noticed that customers raised more issues with leaving or switching their service providers because they were unable to cancel their wireless or internet services or unable to port (transfer) their phone services to another provider.

Notably, unable to cancel issues increased by 31% from last year, most significantly with wireless and internet customers this past year. These issues are about customers who request to cancel their services, but the provider refuses, or a system error prevents the cancellation. The occurrence of issues where customers could not port their service increased by 23%. Among these complaints, 71% were wireless customers and 29% were local phone services. We will continue to monitor these issues as customers ought to be able to easily cancel or switch their services and providers.

Credit management issues

Credit management issues like credit reporting and security deposits account for 4% of all issues. Credit management issues were raised 1,121 times this year and decreased by 17% year-over-year.

Figure 7.20: Five-year view of credit management issues


Credit reporting issues

The vast majority, about 94%, of credit management issues are about third-party credit reporting. The number of credit reporting issues decreased by 16% from last year. Wireless customers account for 62% of all credit reporting issues, up from 59% last year.

Figure 7.21: 3rd party credit reporting issues by service type
Table 7.23: 3rd party credit reporting issues – Top 3 service providers
Service provider Number of times issue was raised Proportion of issue
Rogers 207 20%
Bell 180 17%
TELUS 178 17%

Key Message: Third Party Credit Reporting

When there is a dispute about credit reporting, the service provider must demonstrate that it had the authority to make a credit report. We assess whether the circumstances for making the credit report were valid. For example, did the customer fail to pay for the services by the due date? We also verify the provider’s compliance with their internal credit reporting procedures by confirming that the appropriate steps were taken to report to the credit bureau and that the reporting was accurate.

If we determine that the circumstances to report were not valid, we will require the provider to demonstrate that they have corrected the credit report and consider whether any compensation is required to the customer as a result of any proven loss, damage, or inconvenience arising directly from the unjustified credit reporting.

“Excellent service. I felt understood as a consumer and felt like I had a voice. I was happy to receive a response within a few days. I was quickly satisfied. Great job.”

Wireless Customer from Moncton, New Brunswick

Working with Service Providers

Annual Report

August 1, 2022 – July 31, 2023

The mission of the CCTS is to provide outstanding dispute resolution service to Canadian customers and telecommunications and television service providers.

We help resolve disputes and conduct our work in keeping with our values: to be effective, rigorous, competent, unbiased, fair, responsive, and accessible.

When customers and service providers are unable to resolve their disputes, the CCTS determines whether the provider acted appropriately and reasonably in the matter. The CCTS works to identify the key drivers of customer complaints so that service providers can better understand their customers’ complaints and consider internal change to address the issues raised, and so that customers can be informed of trends in complaints.

National PSP groups complaint proportion analysis across last five years

In this section, we review the percentage of customer complaints related to major national service provider groups. These groups represent the largest telecom and TV service providers which offer wireless services nationally to consumers and internet, phone, and TV service to large regions of Canada. These providers offer services to consumers through various brands, subsidiaries, and affiliates.

  • Rogers group: Rogers Communications, Source Cable Ltd., Simply Connect, Kincardine Group, Fido, Compton Communications, Cityfone, Chatr Wireless, Cable Cable Inc., Cross Country TV, RuralWave, Seaside Communications powered by Rogers, Seaside Wireless powered by Rogers, Zoomer, Shaw, Shaw Direct, KWIC Internet
  • Bell group: Bell Canada, Bell Aliant, Bell MTS, Dryden Municipal Telephone System (DMTS), Kenora Municipal Telephone System (KMTS), Lucky Mobile, PC Mobile (pre-paid), Solo Mobile, Virgin Plus, Bell Mobility, Vox, Bell Satellite TV, Axia FibreNet, Distributel, Acanac, Navigata, EBOX, Primus, Télébec, Cablevision du Nord de Québec, Groupe Maskatel Québec S.E.C., NorthernTel, Ontera, Northwestel
  • TELUS group: TELUS Communications Inc., Koodo, Mascon Communications Inc, PC Mobile (post-paid), Public Mobile, TELUS Satellite, Mascon Cable, ABC Communications, Omega Cable, Start.ca, Altima Telecom, GTA Telecom Inc., GoCo.
Figure 8.1: Accepted complaints trend over three national PSP groups
Figure 8.2: Proportion of accepted complaints for the three national PSP groups

There was a significant amount of industry consolidation this year, as all three national PSP groups acquired various telecommunications and television providers. Most notably, Rogers completed its acquisition of Shaw. Of note for the other two PSP groups, Bell acquired smaller providers such as Distributel, Acanac, Primus, and EBOX, while TELUS acquired providers like Start.ca and Altima Telecom.

  • The Rogers, Bell, and TELUS groups showed an upward trend in complaint numbers this year.
  • The three national PSP groups accounted for 81% of all accepted complaints this year, up 9% (from 72%) last year.
  • Among the three national PSP groups, the Rogers group experienced the most significant increase in the proportion of total complaints over the last five years. This year marked the largest year-over-year increase. Its proportion of accepted complaints increased by 9%, from 27% last year to 36% this year.
  • The Bell group accounted for 25% of all accepted complaints across all service providers, down 3% from the previous year. This continues a downward trend in their portion of accepted complaints over the last five years. Since 2018, the number of accepted complaints about the Bell group has decreased by over 51%, from 7,646 reported in 2018-19 to 3,658 this year.
  • This year, the TELUS group accounted for 20% of all accepted complaints across all service providers, up from 17% last year.

Top 25 Participating Service Providers

Table 8.1: Top 25 PSPs by complaints accepted

* The number of concluded complaints can be higher than the number of accepted complaints because some complaints accepted in 2021-22 were concluded in 2022-23.
† The resolution rate is the percentage of all resolved complaints vs. all concluded complaints (89% overall).
‡ The escalation rate is the percentage of all escalated complaints vs. all concluded complaints (16.9% overall).

NOTE: Where a complaint remains unresolved after the pre-investigation or initial referral period, the complaint escalates to conciliation or investigation.


Together, the top 25 PSPs accounted for 95% of all accepted complaints in 2022-23. The remaining 5% of accepted complaints, 753 complaints, are about 157 service providers.

Top 3: For the first time in our annual reporting, Rogers emerged as the service provider with the highest number of complaints, followed by Bell and TELUS.

Top 10: Overall, the majority of the service providers in the Top 10 list stayed in the list, with the exception of Xplore which was replaced by Fizz.

Top 25: There are a few changes to the list of service providers that fall into the Top 25 PSP list this year. Notably, the following service providers experienced a significant increase in accepted complaints, compared to the 14% increase in overall complaints:

  • Rogers (44% increase),
  • TELUS (43% increase),
  • Eastlink (132% increase),
  • Phonebox (129% increase),
  • Starlink (229% increase), and
  • EBOX (153% increase).
  • Phonebox, Starlink, and EBOX enter the Top 25 list for the first time.
  • Bell MTS and Xplore experienced a significant drop in accepted complaints, seeing year-over-year declines of 52% and 42% respectively.
Figure 8.3: Top 10 PSPs by complaints accepted


Figure 8.4: Top 10 PSPs by resolution rate

The resolution rate is the percentage of all resolved complaints vs. all concluded complaints (89% overall).

Rogers

Wireless Internet Phone TV

Highlights

  • Complaints about Rogers increased by 44% compared to a 14% increase in complaints for all service providers this year. It is a notable increase and makes Rogers the most complained about service provider in 2022-23.
  • Rogers accounts for 20% of all accepted complaints. Over the past four years, Rogers has shown an upward trend in its proportion of accepted complaints, going from 11% to 20%.
  • Rogers’ wireless issues increased by 35% compared to last year, a significant increase considering a 6% increase in wireless issues across all service providers. Wireless issues account for 45% of all Rogers’ issues.
  • Rogers’ customers raised internet issues 32% more often than last year. Internet issues account for 31% of all Rogers’ issues.
  • Issues with Rogers’ TV services increased by 35% this year. By comparison, TV issues decreased by 12.5% across all service providers.
  • Service delivery issues for all of Rogers’ service types increased by 49% this year. This is a significant increase compared to a 10% increase in service delivery issues across all service providers. A major contributor to Rogers’ service delivery issues was a significant increase (138%) in complete loss of service Rogers accounts for the highest proportion of complete loss of service issues at 29%, up 11% from last year.
  • Rogers’ customers raised the following issues more often than last year:
    • Complete loss of service — 138% increase
    • Incorrect charge — 34% increase
    • Credit or refund not received — 66% increase
    • Quality of service — 26% increase
  • Rogers had two confirmed breaches of the Wireless Code, a decrease from seven breaches last year and 25 breaches in 2020-21. Both breaches were about disconnection issues, in which Rogers failed to include all relevant information and provide the required notice to the customer before disconnection.
  • Rogers also had two confirmed breaches of the Internet Code this year about disconnection issues.

Statistics

2,893 accepted complaints
43.6% change in accepted complaints 19.8% of all accepted complaints
2,435 resolved complaints
2,092 resolved at pre-investigation or initial referral 343 resolved at conciliation or investigation 89.7% resolution rate
(Global – 89%)
Top 3 issues across all service types
15% disclosure issues 14% incorrect charge for monthly price plan 12% quality of service
4 Code breaches
2 Wireless Code breaches 2 Internet Code breaches 0 TVSP Code breaches 0 D&D Code breaches

Bell

Wireless Internet Phone TV

Highlights

  • Complaints about Bell increased by 7% this year. By comparison, the CCTS saw a 14% increase in complaints across all service providers.
  • Bell accounts for 16% of all accepted complaints, down from 17% last year and 21% the year before.
  • Bell’s wireless issues decreased by 19%, a significant decrease compared to the 7% increase of wireless issues across all service providers. Bell’s wireless issues account for 44% of their overall issues, which is lower than the overall proportion of wireless issues across all service providers, 55%.
  • Bell’s internet issues decreased by 13% this year. Internet issues account for 29% of all Bell issues, up from 27% last year.
  • TV issues account for 12% of all Bell issues, down from 14% last year. Bell’s TV issues decreased 30% this year, which represents the largest decrease in Bell’s issues this year.
  • Disclosure issues were Bell’s most-raised issue this year, accounting for 14% of the service provider’s issues. Issues related to incorrect charge of the monthly price plan dropped to second place, accounting for 13% of Bell’s overall issues.
  • Bell had five confirmed Wireless Code breaches this year. These breaches account for 10% of all confirmed breaches under the Wireless Code. Three confirmed breaches were about unlocking issues, and the other two confirmed breaches were about key terms in the contract and failure to use plain language.

Statistics

2,355 accepted complaints
7.1% change in accepted complaints 16.1% of all accepted complaints
1,746 resolved complaints
1,361 resolved at pre-investigation or initial referral 385 resolved at conciliation or investigation 84.4% resolution rate
(global – 89%)
Top 3 issues across all service types
14% disclosure issues 13% incorrect charge for monthly price plan 12% quality of service
5 Code breaches
5 Wireless Code breaches 0 Internet Code breaches 0 TVSP Code breaches 0 D&D Code breaches

TELUS

Wireless Internet Phone TV

Highlights

  • Complaints about TELUS increased by 43%, a significant increase compared to a 14% increase in complaints for all service providers.
  • TELUS accounts for 12% of all accepted complaints, up from 10% last year and 7% the year before.
  • TELUS’ wireless issues increased by 48%, a significant increase compared to the 7% increase in wireless issues across all service providers. Wireless issues account for 57% of TELUS’ issues.
  • TELUS’ internet issues increased by 29% more than last year. Overall, internet issues decreased by 6% across all service providers. Internet issues account for 23% of TELUS’ issues.
  • TV issues account for 9% of all TELUS issues, down from 11% last year. However, TELUS’ customers raised 21% more TV issues than last year, compared to a decrease of 13% over all the service providers.
  • Disclosure issues returned to first place as the most complained-about issue accounting for 15.7% of all TELUS’ issues.
  • Issues about incorrect charges declined to the second most-raised issues for TELUS accounting for 15.5% of all TELUS issues even though its customers raised it 49% more often than last year.
  • TELUS’ Code breaches continue to significantly outpace all other service providers, with a total of 21 confirmed Code breaches this year.
    • TELUS had four Wireless Code breaches. Two of those four involved TELUS not giving required notice to customer before disconnection.
    • With three confirmed Internet Code breaches this year, TELUS contributes to 37.5% of the overall Internet Code breaches. All the confirmed breaches of the Internet Code are about failure to provide customers with the required notice before making changes to other contract terms and conditions.
    • TELUS had 13 TVSP Code breaches, which account for 93% of all confirmed TVSP Code breaches. Twelve of TELUS’ breaches were about changes to the customer’s programming options.

Statistics

1,798 accepted complaints
43.2% change in accepted complaints 12.3% of all accepted complaints
1,585 resolved complaints
1,454 resolved at pre-investigation or initial referral 131 resolved at conciliation or investigation 89.6% resolution rate
(Global – 89%)
Top 3 issues across all service types
16% disclosure issues 15% incorrect charge for monthly price plan 10% quality of service
21 Code breaches
4 Wireless Code breaches 4 Internet Code breaches 13 TVSP Code breaches 0 D&D Code breaches

Fido (Rogers group)

Wireless Internet

Highlights

  • Complaints about Fido increased by 28%. This is significant, given the 14% increase in complaints for all service providers.
  • Fido accounts for 12% of all accepted complaints, up from 10% last year.
  • Fido’s wireless-related issues account for 91% of all its issues, down from 93% last year.
  • Internet issues account for 9% of Fido’s total issues, up from 8% last year.
  • Issues about incorrect charges related to the monthly price plan was the most-increased issue raised by Fido customers, with a 45% increase compared to last year. This is of concern when compared to a 1% increase in the same issue across all service providers. Issues with incorrect charges account for 16% of all Fido’s issues, up from 13% last year.
  • Another two increasingly-raised issues by Fido customers are roaming charges (up by 144%) and issues about credit or refund not received (up by 85%).
  • Fido had two confirmed breaches of the Wireless Code this year. One of the two breaches was about Fido not including all the information required by the Wireless Code in its contract with the customer. The other confirmed breach was about changes to key contract terms.

Statistics

1,704 accepted complaints
28.3% change in accepted complaints 11.7% of all accepted complaints
1,496 resolved complaints
1,337 resolved at pre-investigation or initial referral 159 resolved at conciliation or investigation 91.6% resolution rate
(Global – 89%)
Top 3 issues across all service types
21% disclosure issues 16% incorrect charge for monthly price plan 9% credit/refund not received
2 Code breaches
2 Wireless Code breaches 0 Internet Code breaches 0 D&D Code breaches

Koodo (TELUS group)

Wireless

Highlights

  • Complaints about Koodo increased by 23% compared to a 14% increase in complaints for all service providers.
  • Koodo accounts for 7% of all accepted complaints, the same as last year.
  • Koodo’s wireless issues increased by 18%, compared to a 7% increase in wireless issues across all service providers.
  • Koodo’s top issue is incorrect charge related to monthly price plan, which increased by 33% this year. Koodo has seen an increase in this issue over the past six years.
  • Notably, Koodo’s quality of service issues increased by 40%, compared to a decrease of 3% in quality of service issues across all service providers. Quality of service issues account for 7% of Koodo’s issues, up from 6% last year.
  • Koodo had five confirmed Wireless Code breaches this year, down from eight last year. Two breaches were about issues during the trial period. The other breaches are due to Koodo’s failure to provide a Critical Information Summary, not providing the permanent (paper or electronic) copy of the contract to the customer; and not giving notice or all required information to the customer before disconnection.

Statistics

1,016 accepted complaints
22.7% change in accepted complaints 7.0% of all accepted complaints
952 resolved complaints
872 resolved at pre-investigation or initial referral 80 resolved at conciliation or investigation 90.3% resolution rate
(Global – 89%)
Top 3 issues across all service types
15% incorrect charge for monthly price plan 15% disclosure issues 7% credit reporting
5 Code breaches
5 Wireless Code breaches 0 D&D Code breaches

Freedom Mobile (Quebecor group)

Wireless Internet

Highlights

  • Complaints about Freedom Mobile increased for the first time in four years. This year Freedom Mobile’s complaints increased by 11%, compared to a 14% increase in complaints for all service providers.
  • Freedom Mobile accounts for 6% of all accepted complaints, unchanged from last year.
  • The vast majority of Freedom Mobile’s issues continue to be about wireless services, representing 97% of all its issues, down from 98% last year. Freedom began offering internet services in 2019 and we recorded 38 issues about its internet services this year.
  • The top three issues raised by Freedom Mobile customers were: disclosure issues (15% of Freedom Mobile’s issues), incorrect charge of monthly price plan (11% of Freedom Mobile’s issues), and roaming charges (9% of Freedom Mobile’s issues).
  • Freedom Mobile had four confirmed breaches of the Wireless Code, down from 12 last year. The four breaches account for 8% of all confirmed breaches of the Wireless Code. Three of its breaches are about disconnection issues like failure to give required notice or information to the customer before disconnection. One breach was about its failure to suspend roaming data charges once they reached $100.

Statistics

837 accepted complaints
11.2% change in accepted complaints 5.7% of all accepted complaints
785 resolved complaints
736 resolved at pre-investigation or initial referral 49 resolved at conciliation or investigation 92.9% resolution rate
(Global – 89%)
Top 3 issues across all service types
15% disclosure issues 11% incorrect charge for monthly price plan 9% roaming charges
4 Code breaches
4 Wireless Code breaches 0 Internet Code breaches 0 D&D Code breaches

Virgin Plus (Bell group)

Wireless Internet Phone

Highlights

  • Complaints about Virgin Plus decreased by 11%, despite a 14% increase in complaints for all service providers.
  • Virgin Plus accounts for 6% of all accepted complaints, down from 7% last year.
  • Wireless issues decreased by 29%, and account for 82% of all Virgin Plus’ issues.
  • Virgin Plus’ internet issues decreased by 22% in contrast to the decrease of 7% of internet issues across all service providers. Internet issues account for 16% of Virgin Plus’ issues.
  • Disclosure issues are still the most complained-about issue for Virgin Plus, accounting for 15% of all Virgin Plus issues.
  • There was a significant decrease in issues relating to incorrect charges (28% decrease), credit reporting (45% decrease) and device financing plans (68% decrease).
  • Virgin Plus had 14 confirmed Code breaches, up from 13 last year.
    • Virgin Plus had 13 confirmed breaches of the Wireless Code, up from 11 last year, accounting for 27% of all the confirmed Wireless Code breaches. Nine breaches were about not providing customers all required information or notice before disconnection. Two breaches were related to not providing a Critical Information Summary and two breaches were about failure to provide required information in the contract.
    • The single Internet Code breach was about a disconnection issue.

Statistics

836 accepted complaints
-11.2% change in accepted complaints 5.7% of all accepted complaints
700 resolved complaints
531 resolved at pre-investigation or initial referral 169 resolved at conciliation or investigation 87.7% resolution rate
(Global – 89%)
Top 3 issues across all service types
16% disclosure issues 12% incorrect charge for monthly price plan 8% credit/refund not received
14 Code breaches
13 Wireless Code breaches 1 Internet Code breaches 0 D&D Code breaches

Videotron (Quebecor group)

Wireless Internet Phone TV

Highlights

  • Complaints about Videotron decreased by 20% compared to a 14% increase in complaints for all service providers.
  • Videotron accounts for 3% of all accepted complaints, down from 5% last year.
  • Videotron’s wireless issues decreased by 29% while overall wireless issues increased by 7% across all service providers. Wireless issues account for 34% of all Videotron issues, up from 26% last year.
  • Videotron’s internet issues decreased by 45%, while overall internet issues decreased by 7%. Internet issues account for 34% of all Videotron issues, unchanged from last year.
  • TV-related issues decreased by 57% for Videotron, while TV issues across all service providers decreased by 13%. TV issues account for 21% of all Videotron issues, down from 27% last year.
  • The top three issues raised by Videotron customers were disclosure issues (18% of Videotron’s issues), incorrect charge (16% of Videotron’s issues), and issues with changes to the contract (7% of Videotron’s issues).
  • Videotron had three confirmed Wireless Code breaches this year, compared to 10 last year. These Wireless Code breaches represent 6% of all Wireless Code breaches. These breaches are related to Videotron’s failure to provide customers with all required information or notice before disconnection.

Statistics

490 accepted complaints
-19.7% change in accepted complaints 3.4% of all accepted complaints
413 resolved complaints
363 resolved at pre-investigation or initial referral 50 resolved at conciliation or investigation 90.2% resolution rate
(Global – 89%)
Top 3 issues across all service types
19% disclosure issues 16% incorrect charge for monthly price plan 7% changes to the contract
3 Code breaches
3 Wireless Code breaches 0 Internet Code breaches 0 TVSP Code breaches 0 D&D Code breaches

Shaw (Rogers group)

Wireless Internet Phone TV

Highlights

  • Complaints about Shaw decreased by 22% compared to a 14% increase in complaints for all service providers.
  • Shaw accounts for 3% of all accepted complaints, down from 4% from last year and 5% the year before.
  • Internet issues were the top complained-about service by Shaw’s customers despite decreasing by 31% from last year. By comparison, internet issues decreased by 7% across all service providers. Internet issues account for 52% of Shaw’s issues.
  • TV issues account for 25% of Shaw’s issues. Shaw’s TV issues decreased by 31%, compared to a 13% decrease of TV issues across all providers.
  • Wireless issues account for 11% of all Shaw’s issues, down from 14% last year. Notably, Shaw’s wireless issues decreased by 49%, even though there was a 7% increase in wireless issues across all service providers.
  • The top three issues raised by Shaw’s customers were: quality of service (17% of Shaw’s issues), disclosure issues (12% of Shaw’s issues), and issues with incorrect charges (10% of Shaw’s issues).
  • Shaw had eight confirmed breaches of the Wireless Code, up from five last year. Five of the breaches were about Shaw’s failure to provide a permanent (paper or electronic) copy of the contract to customers, or the contract did not include all the information listed in the Wireless Code. The remaining three breaches were about not providing required information in the Critical Information Summary.

Statistics

435 accepted complaints
-22.0% change in accepted complaints 3.0% of all accepted complaints
366 resolved complaints
317 resolved at pre-investigation or initial referral 49 resolved at conciliation or investigation 88.2% resolution rate
(Global – 89%)
Top 3 issues across all service types
17% quality of service 12% disclosure issues 10% incorrect charge for monthly price plan
8 Code breaches
8 Wireless Code breaches 0 Internet Code breaches 0 TVSP Code breaches 0 D&D Code breaches

Fizz (Quebecor group)

Wireless Internet

Highlights

  • Complaints about Fizz increased by 20% compared to a 14% increase in complaints for all service providers. This is the third year that complaints about Fizz increased.
  • Fizz accounts for 1% of all accepted complaints, the same as last year. This marks the first time Fizz has been one of our top 10 most complained about providers and marks the highest number of complaints for the service provider in three years.
  • Wireless issues represent 67% of all Fizz’s issues.
  • Fizz’s internet issues increased by 70% this year. This is significant given that there was a 7% decrease in internet issues across all providers. Fizz’s internet issues account for 33% of Fizz’s issues.
  • This year, the increase in Fizz’s wireless and internet issues are predominantly driven by service delivery issues related to installation or cancellation due dates not kept or delay, complete loss of service, and quality of service. Quality of service issues were the top issue raised by Fizz’s customers and account for 18% of its issues.
  • Fizz had no confirmed Code breaches this year.

Statistics

190 accepted complaints
19.5% change in accepted complaints 1.3% of all accepted complaints
175 resolved complaints
161 resolved at pre-investigation or initial referral 14 resolved at conciliation or investigation 92.1% resolution rate
(Global – 89%)
Top 3 issues across all service types
18% quality of service 13% due dates not kept/delay 10% complete loss of service
0 Code breaches
0 Wireless Code breaches 0 Internet Code breaches

Monitoring service provider compliance

There are two categories of service provider requirements: the CRTC requirement to participate in the CCTS, and the CCTS requirements that a service provider agrees to when it becomes a Participating Service Provider (PSP).

To ensure the CCTS can provide free and effective service to customers when they need it, the CRTC requires providers of retail telecom services in Canada and licensed TV service providers to participate in the CCTS.

Some service providers, typically small providers or new entrants to the industry, do not currently participate. However, they are required to join when one of their customers files a complaint with the CCTS. We also receive requests from some service providers who voluntarily choose to participate in the CCTS.

We do everything in our power to facilitate service providers joining the CCTS and we’re generally successful. This past year, the CCTS updated its sign-up process requirements and ceased charging a sign-up fee to further simplify sign-ups for small service providers.

In 2022-23, we signed up 23 new service providers and it took, on average, 44 days to sign up a new service provider.

Unfortunately, some providers refuse to join the CCTS. If we’re unable to persuade them to follow the CRTC regulatory requirement to become a PSP, we refer the matter to the CRTC for further action. In 2022-23, the CRTC initiated a show cause proceeding against Optitel Mobile for failing to sign up with the CCTS when required to do so. The CRTC also issued two decisions about previously referred service providers that failed to sign up. It determined that Haute-Vitesse.com was no longer operating but found it had contravened the Telecommunications Act for a specific period of time when it was required to join the CCTS. It also ordered telecommunications service provider Net2Web to join the CCTS within 60 days of the order. Net2Web failed to join the CCTS and the CCTS advised the CRTC accordingly.

After a provider has become a PSP, it is required to adhere to the obligations outlined in the CCTS Participation Agreement, including:

The CCTS regularly monitors PSP compliance with these obligations and engages with PSPs to bring them into compliance. If a PSP continues to be non-compliant, the CCTS has a range of enforcement tools to seek compliance, up to and including the expulsion of non-compliant PSPs from the CCTS. This triggers a referral to the CRTC for further action.

In April 2023, the CCTS terminated the participation of ICA Micro-Systems Inc. (ICA) for non-compliance with participation requirements, notably failing to implement a CCTS-issued Decision. ICA has since re-joined the CCTS after rectifying all non-compliance issues, including issuing a refund to the customer as was required by the CCTS’ Decision.

In July 2023, we issued the annual Compliance Monitoring Report, which explains the compliance requirements in detail, provides the results of the CCTS’ compliance monitoring efforts in 2022, and discusses trends observed in the past few years. The CCTS also regularly updates our non-compliant providers webpage, where we publish the names of providers that have been referred to the CRTC for failure to join the CCTS when required, or that were expelled from the CCTS for failing to comply with CCTS obligations.

Working with Customers

Annual Report

August 1, 2022 – July 31, 2023

Our role has never been more vital than it is today. Technology, consumer expectations, and industry dynamics are constantly changing. Our role is to ensure that customers who have to navigate this complex environment are treated fairly.

This Working with Customers section shows what we have done, with the help of our stakeholders, to shape a more influential and impactful future for the CCTS.

Customer feedback

We ask for feedback from customers who use our service. This helps us to understand how they see our work. Their input guides our continuing efforts to improve our service. It also helps us to assess the effectiveness of the public awareness initiatives we require Participating Service Providers (PSPs) to implement.

In this past year, we collected more than 2,500 responses from our customers. We are proud to report that the results show exceptional levels of customer satisfaction with our service.

Numbers may be rounded.

What customers said about the CCTS

We asked our customers for the following information:

Is it important to have an independent organization to deal with telecom and TV complaints that has the authority to provide customers with compensation?

Was it easy to file your complaint with the CCTS?

Feedback on whether the service you received from CCTS representatives met customer expectations.

Feedback on whether the service you received from our complaint resolution officers met your expectations.

Feedback on overall satisfaction with various aspects of our process.

Timelines: Did we complete our work in a reasonable amount of time?

Professionalism: Were we professional, knowledgeable and courteous?

Impartiality: Did we act without favouritism to either you or your service provider?

“As soon as I contacted the CCTS, the process was very easy and helpful.”

Customer who used the CCTS’ services

What customers said about service provider public awareness activities

How did you first find out about the CCTS?

Service providers agreed to notify customers about the CCTS during their internal complaint-handling process. We asked our customers:

Did your service provider tell you about the CCTS during your efforts to resolve the problem?

Service providers are required to print a prescribed message about the CCTS on customer bills four times a year. We asked our customers:

Have you ever seen the notice on any of your bills?

Service providers have agreed to place a prescribed notice about the CCTS in a reasonably prominent place on their websites and to include a link to the CCTS website. We asked our customers:

Have you seen this information on the service provider website?

What customers said about their attempts to resolve complaints with service providers

We asked customers about their interactions with service providers before the CCTS became involved.


How long did you try to resolve your problem directly with your service provider before bringing your complaint to the CCTS?


How many levels of escalation (front line customer service, supervisor, manager, etc.) did your complaint go through with the service provider before you filed a complaint with the CCTS?

Public awareness of the CCTS

We are deeply committed to increasing the public’s awareness of the CCTS and the service we offer. This past year, to commemorate our 15th anniversary, we ran our first digital marketing campaign. We invested in optimizing search results and amplifying social media ads to reach a broader audience. These activities reached a wide audience and directed more traffic and unique visitors to our website. Social media and search engine marketing campaigns with video performed the best, with more engagement and driving significantly more traffic to our website.

We are acutely aware of our ongoing responsibility to ensure that the public knows about the service we provide.  With the help of communications experts, we have developed a robust strategy and new initiatives to continue building public awareness about the CCTS. The strategy, set to launch in 2023-24, will introduce new ways to reach more Canadian consumers, including those who may be more vulnerable. We will measure how well each initiative succeeds in increasing public awareness about our organization and service and adjust future activities accordingly.

In addition to these increased efforts, we will continue to work with civil society groups, consumer groups, and consumer protection agencies. These partnerships help us by:

  • broadening our reach,
  • providing meaningful input, and,
  • serving as valuable channels for spreading the word about the CCTS and our service.

Together with our stakeholders, we are working to improve Canadians’ understanding of the CCTS and our role as a dispute-resolution resource.

Commitment to accessibility

Ensuring all Canadians have easy access to our services is one of our core values. Our commitment reflects the principles of the Accessible Canada Act and the Accessibility for Ontarians with Disabilities Act (our head office is located in Ontario). These two laws guide us in upholding these values:

  • independence,
  • dignity,
  • integration, and,
  • equality of opportunity.

We also consult with groups representing Canadians with disabilities every year. In 2022 and 2023, we held a forum with representatives from nine accessibility groups. We discussed how to improve awareness of the CCTS within the accessibility community.

During our consultation, we learned about the difficulties people with accessibility needs face. We learned that it is important to offer different ways to file a complaint. We recognize that inclusion and representation are crucial. We will continue to seek feedback from under-represented and under-served communities so we can better serve all telecom and television customers in Canada.

Our website is another way we make our service accessible to all. It plays a crucial role in communicating who we are and what we do for Canadians. We work continuously to ensure that it aligns with Web Content Accessibility Guidelines (WCAG) 2.1. This past year, we updated our complaint intake form to make it more customer friendly and accessible. Participants from the Accessibility Consultation reported that it is now much easier to use. We provide the option of closed captioning on all videos, and we provide versions in both American Sign Language (ASL) and langue des signes québécoise (LSQ). Our publications are in an accessible HTML format. These include our Annual, Mid-Year and Compliance Monitoring Reports.

While we strive to ensure that our services to customers are accessible, it is the CRTC which sets the industry standards and requirements related to accessibility in telecommunications and television services. Nonetheless, we continue to monitor accessibility-related issues raised in customer complaints. We refer complaints about accessibility to the CRTC if the customer wants us to. This ensures a smoother process for the customer.

Find out more about our accessibility policies and guidelines on our Accessibility web page and in our Accessibility Plan.

“We appreciate the CCTS listening to us and wanting to make changes… we would like ongoing engagement and partnership!”

Accessibility Group

Gaining insights into customer experiences

Understanding the diverse needs and challenges of consumers across the country remains a cornerstone of our commitment to serving people in Canada. Twice in 2022-23, we met with the Consumer Advisory Panel, a group of representatives from different Canadian consumer advocacy groups. This panel serves as a place for dialogue so we can identify opportunities to work together to broaden our outreach to customers, and to improve how well people understand our mandate, operations and reporting.

This past year, we brought together representatives from nine groups who, together, represented vulnerable and hard-to-reach customers, and customers from geographically diverse regions.

During these sessions, we dug into issues that affect the lives of Canadians. The panel told us that we need more public awareness activities so that Canadians know about the CCTS. They also urged us to extend our efforts to vulnerable customers. We will consider these ideas and suggestions as part of our planned new public awareness initiatives in 2023, 2024 and beyond.

This ongoing dialogue helps us to:

  • identify emerging trends in the consumer landscape,
  • explore collaborative opportunities for wide community engagement,
  • and strengthen awareness of the CCTS and the service we provide.

We look forward to future discussions with consumer advocacy groups to help us improve our understanding of the customer experience and the unique needs of vulnerable consumers.

Other Statistical Highlights

Annual Report

August 1, 2022 – July 31, 2023

Contact Centre activities

Our Contact Centre received approximately 98,000 communications by telephone, in writing, and by online chat, up from 94,000 last year, a 4% increase.

Table 10.1: Communications received
Type of communication 2022-23 YoY change
Written correspondence 33,043 -9%
Phone calls answered 61,483 13%
Chat sessions answered 3,415 10%

Phone calls continue to be the most-used type of communication, followed by written correspondence, which includes use of our online complaint form, and chat sessions.

Out-of-mandate issues

The following tables show the count of customer-raised issues between August 1, 2022 and July 31, 2023 that fell outside the scope of the CCTS’ mandate, and therefore could not be accepted for resolution. The Canadian Radio-television and Telecommunications Commission (CRTC) sets the CCTS’ mandate and periodically reviews whether the mandate continues to be appropriate.

The scope of complaints that the CCTS is authorized to receive and examples of services and subjects that fall outside the CCTS’ scope are set out in our Procedural Code. When we receive complaints outside our mandate, such as issues of pricing, infrastructure, and privacy, we notify the customer and provider and refer the customer to a more appropriate organization or complaint-handling body.

Procedural Code Section 3

Table 10.2: Procedural Code Section 3
Issue Number
Out-of-scope Telecom Issues
Internet applications and content, s. 3.1(a)(i) 332
Infrastructure
s. 3.1(c)(vi) rights of way, s. 3.1(c)(vii) plant, poles, towers, s. 3.1(c)(iv) networking services
1,287
Customer equipment and wiring
s. 3.1(c)(i) customer-owned equipment, s. 3.1(c)(ii) inside wiring
179
Regulated services
s. 3.1(a)(ii) emergency services, s. 3.1(a)(iii) payphones, s. 3.1.(a)(vi) 900/976 calls
97
Telemarketing and unsolicited spam, s. 3.1.(a)(v) 577
Phone or internet scams 464
Other
s. 3.1(a)(iv) Yellow Pages or business directories
13
Out-of-scope Broadcasting Issues
Content
s. 3.1(b)(i) digital media broadcasting undertaking services, s. 3.1(b)(ii) interactive TVSP services and applications, s. 3.1(b)(iii) broadcasting content, s. 3.1(b)(iv) journalistic ethics, s. 3.1(b)(vi) simultaneous substitution
550
TVSP not required to participate in CCTS 33
Other 18
Other Out-of-mandate Issues
False/misleading advertising, s. 3.1(c)(viii)  323
Aggressive tactics 117
Privacy issues, s. 3.1(c)(ix) 712
Pricing, s. 3.1(c)(v) 695
Security services, s. 3.1(c)(iii) 311
Total for all out-of-mandate issues 5,708

The total number of issues reported in this section decreased from 7,280 last year to 5,708 this year.

Procedural Code Section 4

Complaints about the quality of customer service by providers and providers’ general operating practices and policies do not fall within the CCTS’ mandate. However, we track the inquiries we get about these issues.

Table 10.3: Procedural Code Section 4
Issue Number
Section 4.1 Customer service
Rude representative 1,236
Wait times 1,682
Other – Customer services 977
Total 3,895
Section 4.3 General operating practices and policies 3,369
Total 7,264

In 2022-23, these issues decreased by 21%. This is the second year of decreases in complaints about the quality of customer service and providers’ general operating practices and policies.

Procedural Code Section 10

The CCTS is required to decline complaints in certain situations, in accordance with our Procedural Code. We track and report on these complaints.

Table 10.4: Procedural Code Section 10: Duty to Decline to Take Action
Issue Number
Section 10.1 Service provider not offered opportunity to resolve 982
Section 10.2(b) Matter previously or currently with another agency 941
Section 10.3(a) Facts transpired more than one year ago 1,128
Section 10.3(b) Facts arose prior to Effective Date 20
Total 3,071

Complaints involving events that occurred over one year before the customer filed a complaint decreased by 12% from last year.

Accessibility issues

Most complaints about a service provider’s failure to accommodate a customer’s accessibility request are out of mandate for the CCTS and typically accessibility complaints related to telecom and TV services are in the CRTC’s mandate. However, there are some accessibility issues that the CCTS will consider to be in-scope, specifically, when a CRTC Code that the CCTS administers contains a requirement to provide an accommodation. The Wireless, Television Service Provider, and Internet Codes require extended trial periods for individuals with disabilities and also require customer contracts and related documents to be provided in an accessible format on request.

At the request of the CRTC and members of the accessibility community, we track when customers raise out-of-scope accessibility issues about their service providers. We also refer these issues to the proper organization, the CRTC.

Table 10.5: Out-of-scope accessibility issues

Issue Number
Customer Service – indifferent to customer’s disability 102
Accessibility-related accommodation issue, e.g. VRS, MRS, closed captioning or described video not available, accessible handset not offered, store accessibility issues, refused to provide Accessibility Plan 65
Policies and procedures, e.g. do not include accessibility information or accessibility policy or practice not honoured 53
Total 220

Small business

In 2022-23, we concluded 853 complaints from small business customers, an increase of about 2% over last year. This represents 6.2% of all concluded complaints. The 853 concluded complaints contained 1,862 issues. This represents a 14% decrease in issues from last year.

When we report our operational statistics, we include the data for all the complaints we dealt with during the year. However, not all complaints are alike. In particular, we know that complaints from small business customers can be quite different from those of individual consumers. The following tables illustrate the differences.

Table 10.6: Small business complaint subjects vs. consumer complaint subjects
Subject Small business Consumer
Contract dispute 37.5% 26.0%
Service delivery 29.6% 29.9%
Billing 29.2% 40.2%
Credit management 3.6% 3.9%
Total 100% 100%
Table 10.7: Small business complaint service types vs. consumer complaint service types
Service Small business Consumer
Wireless 38.3% 62.9%
Internet access 37.6% 27.9%
Local exchange and VoIP services (including calling features) 23.6% 8.8%
Long distance (including prepaid calling cards) 0.5% 0.5%
Total 100% 100%


Contract disputes remain the most-raised issue by small business customers, though the proportion of these issues decreased to 37.5% from 41.2% last year. In contrast, billing issues are the most-raised type of issue by individual customers (about 40% in proportion). Service delivery issues reported by small businesses increased in proportion this year to 29.6%, a 3.7% increase from last year.

Table 10.8: Top 10 small business complaint issues
Issue Small business Consumer
Disclosure issues 15.0% 14.6%
Monthly price plan – Incorrect charge 11.1% 13.5%
Termination fee 10.7% 2.3%
Quality of service 9.9% 10.6%
Credit or refund not received 4.9% 6.3%
Complete loss of service 4.8% 5.0%
Due dates not kept or delayed for installation or cancellation 4.6% 5.5%
Changes to the contract 4.5% 4.7%
Renewal of contract 3.6% 0.1%
Breach of contract 3.5% 4.2%

Analysis of closed complaints

Our operational statistics show that we closed 1,502 complaints in 2022-23. The following table provides a breakdown of the reasons why those complaints were closed and references the relevant section of the Procedural Code.

Table 10.9: Complaints closed by reason for closure
Complaint Issues %
Closed as duplicate 49 3.3%
Customer withdrew complaint 160 10.7%
Out-of-mandate after further information obtained 14 0.9%
Section 9.1(b) Customer is not authorized to file complaint 52 3.5%
Section 9.1(c) Complaint more appropriately handled by another agency 22 1.5%
Section 9.1(d) Further investigation not warranted 176 11.7%
Section 9.1(e) Customer not cooperative 791 52.7%
Section 9.1(f) Service provider offer is reasonable* 109 7.3%
Section 10.1 Service provider not offered opportunity to resolve 26 1.7%
Section 10.2(b) Matter previously or currently with another agency 5 0.3%
Section 10.3(a) Complaint filed outside time limits 97 6.5%
Section 10.3(b) Facts arose prior to effective date 1 0.1%
Total 1,502 100%

* With the process changes on May 23, 2023, the CCTS no longer closes complaints if it determines that a service provider met its obligations or that its proposal was reasonable. Now, the CCTS issues written Investigation Findings when a complaint cannot be resolved informally, which increases the transparency of the CCTS’ complaint-handling and decision-making rationale.

We make multiple attempts to elicit customer cooperation before closing a complaint. However, we close complaints under section 9.1(e) of our Procedural Code when a customer does not cooperate with our efforts to process and investigate the customer’s complaints. For example, if a customer does not provide requested information about their complaint, does not respond to our inquiries, or refuses to discuss the complaint with their provider during the 20-day Initial Referral stage, we may choose to close the complaint.

Compensation analysis

In cases that are resolved, as well as where the CCTS issues an Investigation Finding, customers may receive some form of compensation from their service provider. This compensation can take many forms, including:

  • bill credits
  • bill adjustments
  • free or discounted products and services
  • cash payments

We attempt to record the value of all compensation awarded to customers as a result of the CCTS’ process. This is challenging because, in a significant number of cases, we are not provided with the details of the resolution reached between the customer and the service provider. This happens mainly when cases are resolved at the Initial Referral (formerly known as Pre-Investigation) stage.

The total compensation awarded in 2022-23 that we can determine was $4,855,107.45.

Table 10.10: Number of complaints in which compensation was awarded
Compensation range Number of complaints Percentage
< $100 3,177 38.0%
$100 – $499 3,748 44.9%
$500 – $999 863 10.3%
$1,000 – $4,999 489 5.9%
$5,000 or more 74 0.9%
Total 8,351 100%

Performance standards

Each year, we set a goal to provide great customer service, and we track our performance across various benchmarks. The following tables show how our performance this year compares to those benchmark targets.

Because the CCTS changed its process on May 23, 2023, this year we are reporting our performance up until May 22, 2023. We will resume performance standard reporting in the next fiscal year.

Contact Centre – Pre-investigation

Table 10.11: Contact Centre – Pre-investigation performance standards
Process Target 2022-23
Answer phone calls within 120 seconds (Full fiscal year data) 80% 83.4%
Process written communications within 3 calendar days (Aug 1, 2022 to May 22, 2023) 80% 78.5%

Complaint handling

Table 10.12: Complaint handling performance standards
Process Target 2022-23
Complaints concluded at Pre-Investigation stage within 40 days of acceptance (Aug 1, 2022 to May 22, 2023) 80% 90.6%
Complaints concluded at Investigation stage within 60 days of referral to Investigation (Aug 1, 2022 to May 22, 2023) 80% 86.7%

Regional analysis

We receive complaints from customers across Canada. Below, we identify the number of accepted complaints by province and territory.

Table 10.13: Complaints accepted by province/territory
Province Complaints Population*
Alberta 1,409 9.6% 4,703,772 11.8%
British Columbia 2,068 14.1% 5,437,722 13.6%
Manitoba 347 2.4% 1,444,190 3.6%
New Brunswick 251 1.7% 831,618 2.1%
Newfoundland and Labrador 139 1.0% 533,710 1.3%
Northwest Territories 5 0.0% 45,668 0.1%
Nova Scotia 335 2.3% 1,047,232 2.6%
Nunavut 2 0.0% 40,715 0.1%
Ontario 7,099 48.6% 15,500,632 38.9%
Prince Edward Island 64 0.4% 176,113 0.4%
Quebec 2,706 18.5% 8,831,257 22.2%
Saskatchewan 120 0.8% 1,221,439 3.1%
Yukon 14 0.1% 44,412 0.1%
Not specified 58 0.4%
Total 14,617 100% 39,858,480 100%

* Canada, Statistics Canada, Table 17-10-0009-01 (formerly, CANSIM 051-0005)

Governance

Annual Report

August 1, 2022 – July 31, 2023

Board of Directors

Our Board is composed of seven directors, each elected to a three-year term, with a majority being independent of the industry:

  • Four independent directors. Canadian consumer advocacy groups appoint two of them.
  • Three industry directors, one from each of the following groups:
    • the Incumbent Local Exchange Carriers (ILECs),
    • the cable companies, and
    • the other Participating Service Providers (PSPs).

Independent Directors

Catherine Aczel Boivie, PhD, ICD.D (Board Chair, appointed October of 2016)


Patricia Kiley, CPA, CA, ICD.D

Independent Directors: Consumer Group appointees

Geneviève Saumier, B.C.L., LL.B, PhD


Catherine Middleton, MBA, PhD, ICD.D

Industry Directors: ILECs

Ruby Barber, LL.B

Industry Directors: Cable companies

Dean Shaikh, LL.B, LL.M

Industry Directors: Other PSPs

Geoff White, JD, MBA, BCL (Oxon)

For up-to-date biographies, visit our Board of Directors page on our website.

Board changes

In November 2022, Darlene Halwas, CFA, ICD.D, retired from the Board after fulfilling her second three-year term as an Independent Director. In November 2022, the Board appointed Patricia Kiley, CPA, CA, ICD.D, as the new Independent Director.

Board attendance

Committees and working groups: membership and meetings

The Board has the following committees and working groups which are attended by senior leadership at the CCTS. Membership and meeting dates are as follows.

Service Delivery Working Group
Catherine Middleton (Chair), Ruby Barber, Geoff White

2022 Meetings 2023 Meetings
  • August 29
  • September 12 (Barber absent)
  • October 11
  • October 13 (Barber and White absent)
  • November 14
  • December 12
  • December 29
  • January 9
  • February 13
  • March 13 (Barber absent)
  • April 13 (Barber absent)
  • April 27
  • May 8
  • June 8 (Shaikh attended as a guest)
  • June 12

Audit Committee
Darlene Halwas (Chair until November 2022), Geneviève Saumier (elected as Chair in November 2022), Ruby Barber, Patricia Kiley

2022 Meetings 2023 Meetings
  • August 19
  • October 7
  • October 11
  • October 14
  • December 5
  • December 13
  • March 21 (Barber absent)
  • April 6
  • June 7

Corporate Governance Committee
Catherine Aczel Boivie (Chair), Catherine Middleton, Dean Shaikh

2022 Meetings 2023 Meetings
  • August 30
  • October 24 (Shaikh absent)
  • December 15
  • February 16
  • March 10
  • March 23
  • May 15
  • May 16
  • May 25

Corporate Review Committee
Catherine Aczel Boivie (Chair), Catherine Middleton, Geneviève Saumier
Meeting: August 11, 2022

Independent Directors Committee
Catherine Aczel Boivie (Chair), Catherine Middleton, Patricia Kiley, Geneviève Saumier

2022 Meetings 2023 Meetings
  • September 30
  • November 2
  • January 16
  • June 16

Budget Working Group
Geneviève Saumier, Dean Shaikh
Meeting: June 2, 2023

Strategic Planning Working Group
Catherine Middleton (Chair), Catherine Aczel Boivie, Geoff White, Patricia Kiley
Meeting: July 21,2023

CCTS budget

See Appendix C for our audited financial statements for the fiscal year 2022-23.

The CCTS is a not-for-profit corporation originally incorporated under Part II of the Canada Corporations Act. In January 2014, the CCTS was continued under the Canada Not-for-profit Corporations Act.

The CCTS is funded entirely by its Participating Service Providers (PSPs), based on a formula approved by the CCTS’ Members. The service is free for customers who want to file a complaint.

Large PSPs pay a fee based on the proportion of their revenues relative to the total revenues of all the large service providers. Small PSPs pay a nominal annual fee. All providers pay a fee for each of their customers’ complaints that we conclude during the fiscal year. Other sources of revenue are bank interest and sign-up fees charged to new providers (until May 2023, when the CCTS ceased charging the sign-up fee).

In fiscal year 2022-23, our revenues exceeded our budgeted expenses. We will credit this surplus to the PSPs in fiscal year 2023-24.

Appendices

Annual Report

August 1, 2022 – July 31, 2023

Appendix A – Complaints by service provider

Appendix B – Detailed analysis of issues raised in complaints

Appendix C – Financial statements

Appendix D – Nature of incident mapping for 2022-2023

Glossary

Annual Report

August 1, 2022 – July 31, 2023

Definitions

This section provides definitions for key terms contained within this report. To find out more about our new complaint process and related terminology, see Who we are and what we do.
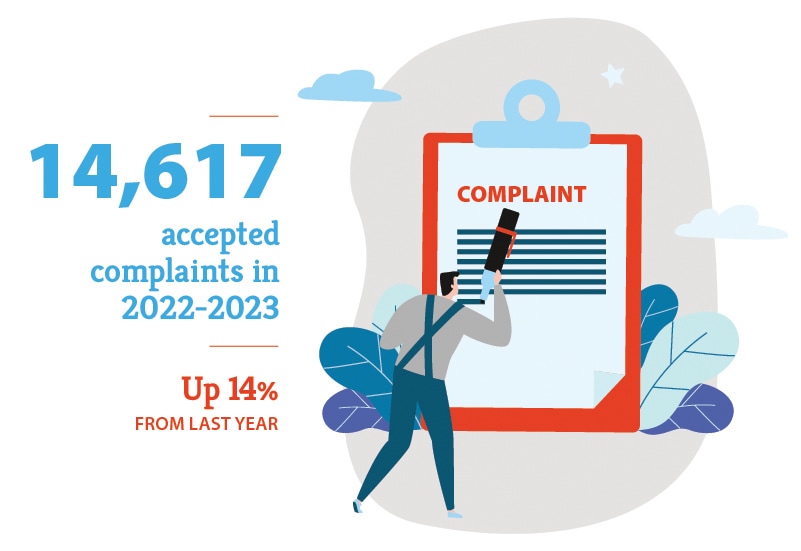

Accepted complaint

An accepted complaint is a complaint by a customer that falls within our mandate.
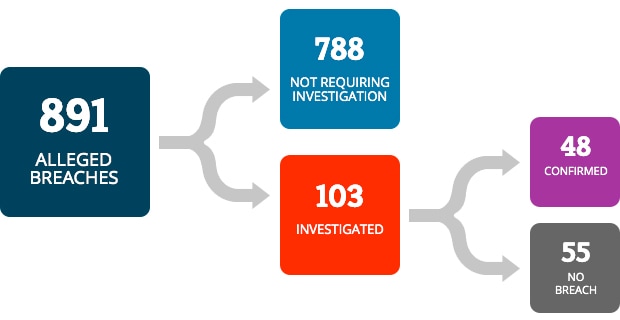
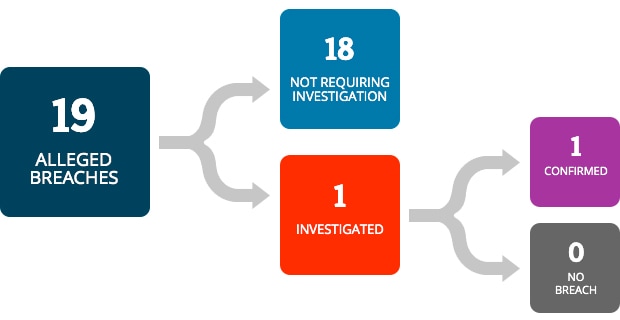

Alleged breach

An alleged breach is one of 2 things:

  • a claim by a customer that a service provider has breached a particular section of a CRTC code
  • a possible breach of a CRTC code that we identified when we assessed the customer’s complaint.

A breach remains an alleged breach until we confirm it through investigation. There may be more than one alleged breach in a complaint.

A breach happens when a service provider fails to follow one of 4 codes of conduct issued by the CRTC:

  • Deposit and Disconnection Code
  • Internet Code
  • Television Service Provider Code
  • Wireless Code

Assessment

During an assessment, we check the information the customer gave us to find out if we can accept their complaint.


Case Review

A Case Review can be requested by the customer or the service provider. They do this if:

  • They think we made an error of fact or interpretation.

and

  • They think our error affected the Investigation Findings.

If it seems more likely than not that we made such an error, we conduct a Case Review. Then, we issue confirmed or amended Investigation Findings.

We began conducting Case Reviews on May 23, 2023.


Closed complaint

A closed complaint is a complaint that we originally accepted but closed for one of several reasons.  The following are 3 examples of reasons for closing complaints

  • We issued Investigation Findings for the complaint.
  • The customer should have taken their complaint to another agency, tribunal, or court.
  • After filing the complaint, the customer either withdrew it, failed to cooperate with our processes, or failed to answer our communications.

Until May 23, 2023, we closed complaints where we found that the complaint was without merit, or the service provider offered to resolve the complaint with the customer and we found the solution to be fair and reasonable under the circumstances.  As of May 23, 2023, we issue Investigation Findings in all these situations.


Conciliation

The CCTS works with the customer and the service provider to informally mediate and explore possible solutions to resolve the complaint, without going to the time and expense of conducting a full investigation that may be unnecessary.


Concluded complaint

A concluded complaint is one that we accepted and resolved or closed. We accepted some complaints during the previous fiscal year that we concluded during this reporting period.


Confirmed breach

A confirmed breach is an alleged breach of a CRTC code that we confirmed through our investigation.


Customer not cooperative

A customer is not cooperative when they fail to do these things:

  • respond to our attempts to communicate with them
  • communicate with the service provider during the Pre-Investigation or Initial Referral stage of our process.

In this situation, following multiple attempts to elicit customer cooperation, we will close the complaint.


Decision

Until May 23, 2023, the Commissioner of the CCTS issued Decisions following this process:

  1. A customer or service provider rejected our Recommendation.
  2. The customer or service provider who rejected the Recommendation sent us their reasons for doing so.
  3. The Commissioner reconsidered the Recommendation.
  4. The Commissioner issued a Decision, which would either confirm the original Recommendation or change the Recommendation if they found it to be incorrect.

Service providers had to abide by the Decisions; customers did not. We no longer issue Decisions.


Further investigation not warranted

We used the term further investigation not warranted until May 23, 2023. It meant that we closed the complaint if we found that the service provider had reasonably performed its obligations to the customer.

As of May 2023, we issue Investigation Findings when a complaint cannot be resolved informally. We do this whether or not we find that a provider has met its obligations to the customer.


Initial Referral

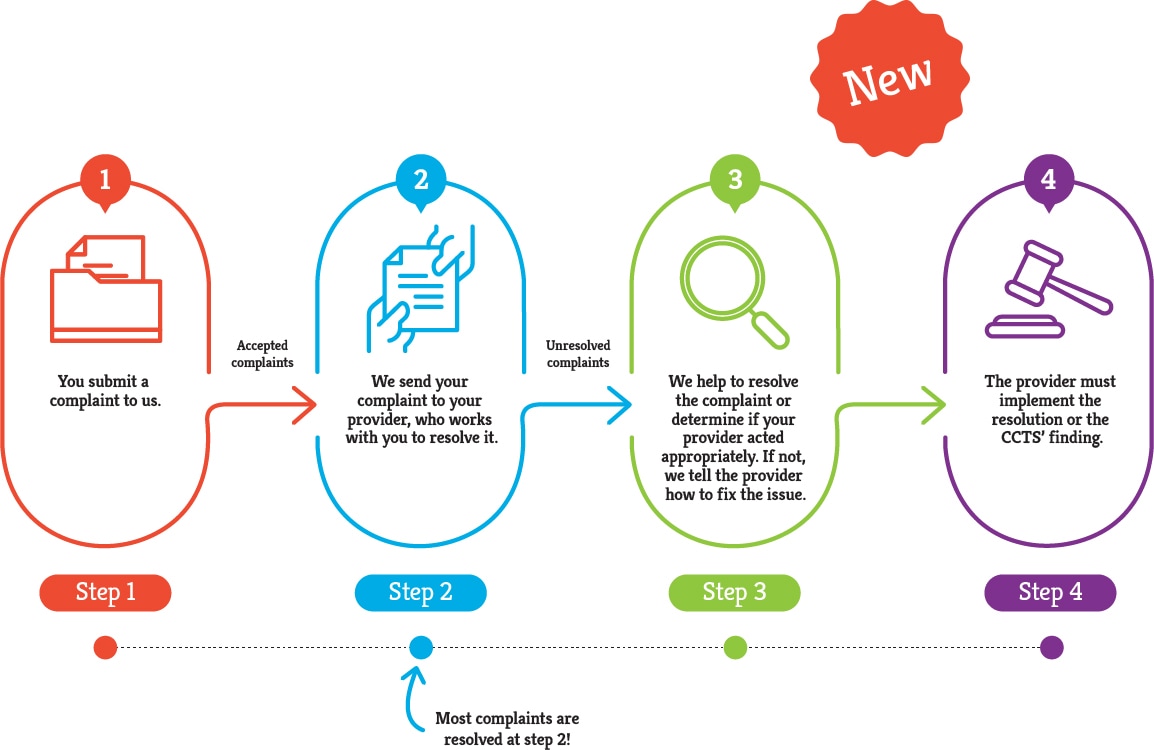
This Initial Referral happens after we accept a complaint. We refer the complaint to the service provider to provide another opportunity to try to resolve it with the customer. The customer and the service provider have 20 days to resolve the issue. If they don’t resolve it, it goes on to the next stage of the process.


Investigation

During the investigation, we analyze and assess the information and documents the customer and the service provider give to us. We want to know if the service provider acted appropriately, and reasonably met its obligations to the customer. Since May 23, 2023, we issue Investigation Findings that explain if the provider met their obligations.


Investigation Findings

Investigation Findings are a written report of the result of our analysis and assessment of the complaint. We base our Findings on the information and documents the customer and the service provider give to us. These Findings explain whether the service provider met their obligations to the customer.  If they did not meet their obligations, the Findings explain what the provider must do to correct the issue. If the provider and the customer both accept the Findings, the provider must make the stated corrections. We then close the complaint. We have been issuing Investigation Findings since May 23, 2023.
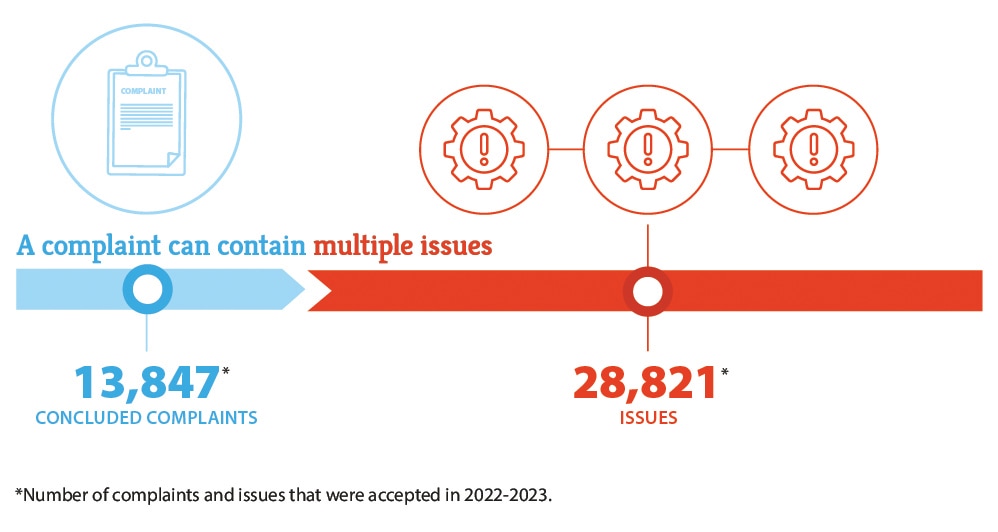

Issue

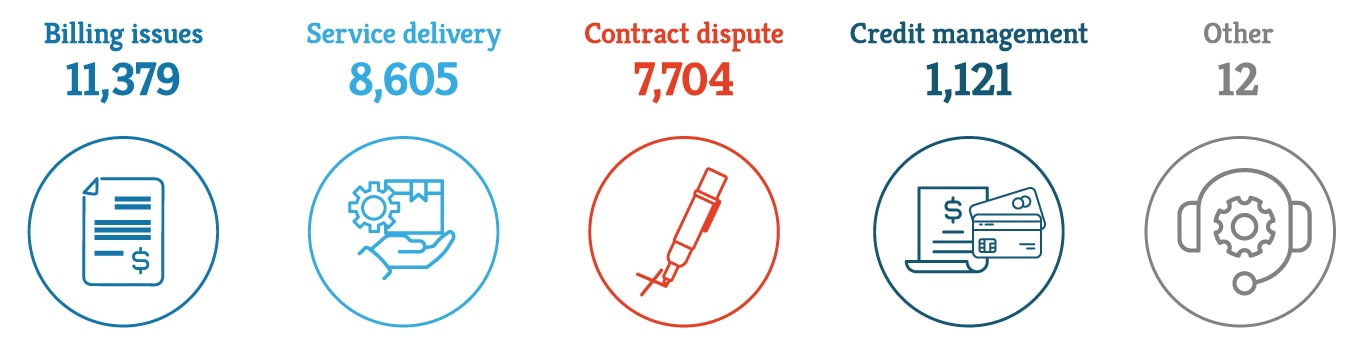
An issue is a specific concern a customer raises in a complaint. A complaint can contain more than one issue. For example, a customer complains that their invoice contains a billing error and that the unpaid balance resulted in a service disconnection. This is one complaint with two separate issues.


No breach

We conclude that there is no breach after we have investigated an alleged breach and found that the service provider did not breach a CRTC code provision.


Out of mandate

Certain complaints fall outside our mandate. These include complaints about privacy, telemarketing calls, and advertising.  As they are out-of-mandate, we cannot accept them.


Pre-Investigation (replaced by Initial Referral)

Until May 23, 2023, Pre-Investigation was the first stage of our complaint-handling process. We referred the complaint to the service provider so they could try to resolve the complaint. The customer and the service provider had 30 days to resolve the issue. If they did not resolve it, it went on to the next stage. Since May 23, 2023, this stage is now called Initial Referral.


Recommendation

Until May 23, 2023, we issued a Recommendation after we investigated a complaint and the service provider did not offer to resolve the complaint, or the service provider offered a solution that we did not find to be reasonable based on the circumstances of the complaint.

We made Recommendations that told the provider what actions to take to resolve the matter. Since May 23, 2023, we no longer issue Recommendations. We now issue Investigation Findings.
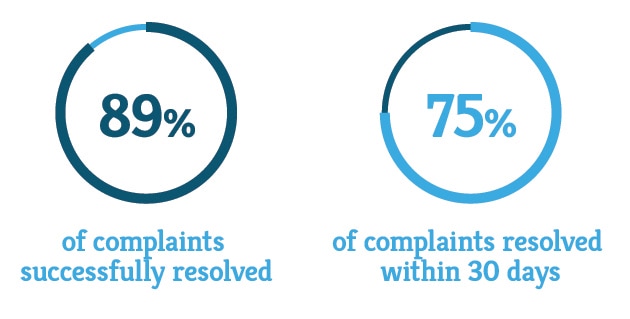

Resolved

A complaint is resolved when both the customer and the service provider agree to the solution.


Service provider offer is reasonable

A service provider’s offer is reasonable when it makes an offer to resolve a complaint and we determine that the offer resolves the problem fairly based on the circumstances of the complaint. In this situation, we would close the complaint even if the customer does not agree that the offer is reasonable.

Since May 23, 2023, we no longer close complaints if we find that the service provider’s offer is reasonable. Now, we issue written Investigation Findings when the customer and service provider fail to resolve the complaint informally. This increases the transparency of our complaint-handling process and our decision-making rationale.
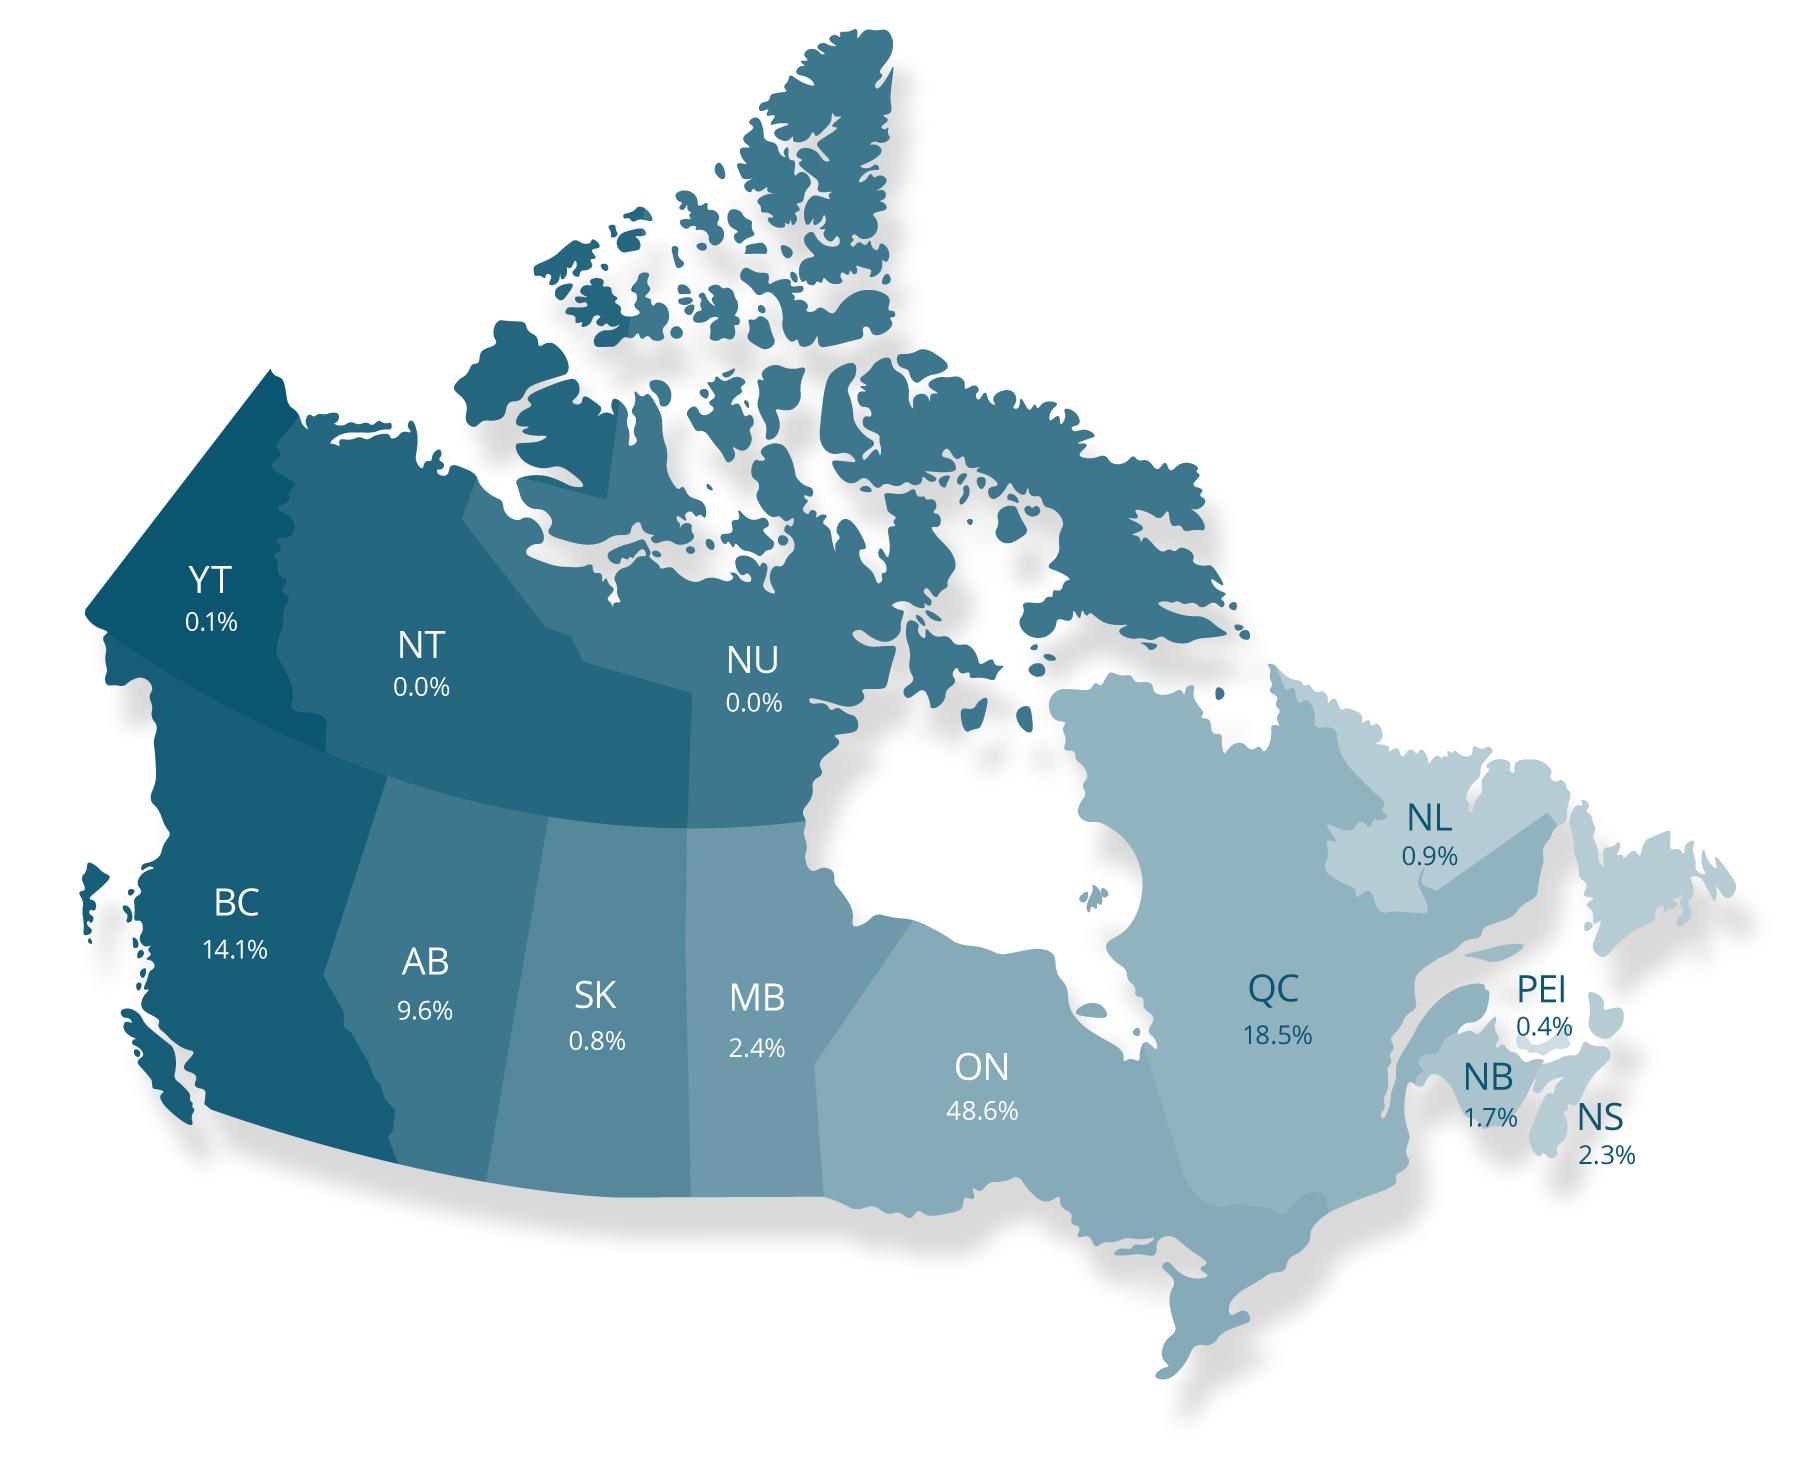
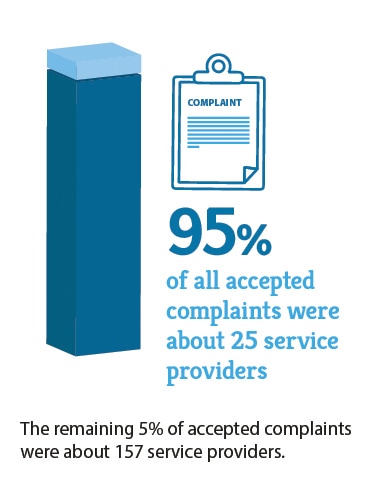
Footnotes

  1. On May 23, 2023, we updated our complaint-handling process. The CCTS no longer uses Decisions in the new process. See 2022-23 Complaints for more details.