Annual Report

August 1, 2024 – July 31, 2025

Chair’s message

Annual Report

August 1, 2024 – July 31, 2025

As Board Chair, I am proud to present the 2024–25 Annual Report. This publication presents a comprehensive look at the complaints we receive, supports service providers in better understanding their customers’ challenges, and offers meaningful insights to inform the development of regulatory policy in the future.

The 2024–25 Annual Report shares the story of CCTS’s telecom and TV complaint activity over the past year. It highlights the important work that extends beyond resolving individual complaints. This year, the CCTS team shared insights from our complaint-handling work to inform the Canadian Radio-television and Telecommunications Commission’s consultations on making it easier for consumers to choose telecom services that offer clearer and more transparent pricing and service information. This included consultations about broadband labels and amendments to the Wireless Code and the Internet Code. The CCTS also continued to strengthen engagement with stakeholders through public awareness initiatives and ongoing collaboration with industry, consumer, and accessibility groups. These collective efforts help ensure that our services remain responsive, inclusive, and effective for everyone who needs them.

I assumed the role of Chair in October 2024 at a pivotal time for the CCTS — one defined by a strengthened commitment to our strategic direction following the launch of a new five-year strategic plan. This period also signalled a leadership change for the organization. I am grateful for the support and encouragement of Catherine Boivie, the outgoing Chair, as I transitioned into this position. Catherine has been an integral part of the CCTS for many years, providing leadership and guidance for the organization through both challenging and rewarding times.

On behalf of the entire Board, I extend our deepest thanks to our founding Commissioner and CEO, Howard Maker, who announced in fall 2024 that he was stepping away from his role at the end of 2025 after 17 years of dedicated leadership. Under Howard’s guidance, the CCTS grew from a small startup with a handful of staff, into a respected national organization known for delivering fair, impartial, and accessible complaint resolution services. Howard’s lasting legacy will be his commitment to building strong, collaborative relationships with stakeholders and achieving meaningful results — an impact that will benefit the CCTS long into the future.

The Board’s Independent Committee invested a significant amount of time and effort into the selection process for a new Commissioner and CEO to succeed Howard. It is with great pleasure that I welcome Josée Bidal Thibault who became the CCTS’ new Commissioner and CEO on January 1, 2026. Josée has 17 years of executive leadership experience, including as the CCTS’ Assistant Commissioner, and she has been instrumental in shaping the CCTS since inception. The Board looks forward to working closely with her to continue strengthening the CCTS as a reliable and accessible service for customers of telecom and TV services in Canada. That means staying grounded in our values, investing in the systems and teams that support our work, and pursuing improvements that benefit both consumers and service providers.

We also saw changes at the Board table this year. In June 2025, Ruby Barber, LL.B. retired from the Board as Incumbent Local Exchange Carriers (ILEC) Industry Director. I thank Ruby for her thoughtful contributions and commitment to good governance. At the same time, we are pleased to welcome Molly Samuelson, LL.B. as newly elected ILEC Industry Director. Molly’s insights and experience will add great value to the work ahead.

As the CCTS navigates this period of change, the Board is confident not only in the organization’s direction but in the strength and dedication of its leadership team to carry our vision forward with purpose and impact. Our focus on the priorities set out in the CCTS strategic plan remain clear: deliver excellent service, create value for all stakeholders, and ensure the organization continues to be effective, resilient, and forward-looking.

Thank you to our staff, leadership, stakeholders, and fellow Board members for your continued commitment to this important work.

Sincerely,

Trish Kiley
Chair of the Board, CCTS

Signature

Commissioner’s message

Annual Report

August 1, 2024 – July 31, 2025

This Annual Report comes at a time when the focus on the role of the CCTS and its work continues to sharpen. The federal government has provided clear direction to the CRTC, the telecom industry regulator, to enhance and protect the rights of telecom consumers, and specifically to strengthen the CCTS’ ability to better fulfill its mandate.

In response to this direction, the CRTC has developed a Consumer Protections Action Plan and is taking steps to improve its Consumer Protection Codes. It has identified “enhancing the effectiveness of the CCTS” as a key objective. It also has several proceedings in the planning stage or in progress to meet these goals.

Telecom markets are forever changing. Social science tells us that humans struggle with change. Over the past few years, the CCTS itself has undergone significant change. A couple of years ago, we made transformative changes to our complaint-handling processes and to supporting technologies. Those changes have been highly successful.

In October 2024, the leadership of our Board of Directors changed, and a new Board Chair (Trish Kiley) was appointed. That’s worked out well, too. They say things come in threes. And now the organization faces another significant change. By the time you read this, my term as Commissioner & CEO will have concluded. I anticipate this change will also work out nicely.

I am very pleased that the CCTS Board appointed my long-time colleague, Josée Bidal Thibault, as the new Commissioner and CEO. I have worked with Josée since 2008 and am very familiar with her many strengths. Josée is not afraid of a challenge, and she will do a wonderful job of leading the CCTS into whatever the future holds for the organization in this ever-evolving environment.

Of course, some things don’t seem to change much. In 2024–25, we accepted a new record-high number of complaints and successfully resolved 86% of them while meeting or exceeding most of our complaint-handling performance targets.

It was an honour to have been appointed as the first CCTS Commissioner in August 2008. It has been a privilege to continue in that role through to the end of 2025. In looking back on those 17-plus years, I have had the pleasure of working with countless dedicated individuals whose primary goal has been to solve problems for Canadians. I have had the opportunity to engage with so many talented, interesting, and committed people, including co-workers, Board members, regulators, service provider representatives, consumer groups, accessibility groups, journalists, and of course, Canadian consumers, who are at the heart of the work we do. My interactions with you have been informative and inspiring. Thank you all for your contributions to the CCTS, and for enriching my experience as its leader.

It’s clear that at this moment we have the attention of the government and the regulator, and that senior industry executives are paying close attention to our work. That’s because the work we do at the CCTS is important and makes a real difference to many Canadians every day. I urge you to continue this work, always ensuring that the best interests of Canadians and our role in the industry are at the forefront.

I wish you every success.

Sincerely,

Howard Maker
Commissioner & CEO, CCTS

Signature

A tribute to Howard Maker

Annual Report

August 1, 2024 – July 31, 2025

Best wishes to our first Commissioner and CEO. After 17 years of dedicated service, we extend our heartfelt thanks to Howard for his exceptional leadership, unwavering integrity, and visionary guidance.

Under Howard’s calm and steady hand, the CCTS evolved from a modest operation into a mature, professional, and respected organization. He steered us through defining moments that transformed our role in the industry, always with a focus on fairness for both consumers and service providers.

During his tenure, the CCTS expanded its mandate to include a broad spectrum of participating service providers and television services. Howard’s strategic insight helped us shape the telecommunications landscape, notably through our contributions to the CRTC’s consumer protection policies — including the development of the Wireless Code and subsequent consumer codes — which led to the CCTS becoming the CRTC’s Code administrator.

Howard’s leadership during the COVID-19 pandemic was a stabilizing force. He ensured that the organization not only adapted but thrived, maintaining our commitment to service, supporting our people, and continuing to evolve in the face of uncertainty.

What we will remember most are the leadership qualities Howard embodied every day. He placed deep trust in the team. His questions — always insightful, sometimes challenging — pushed us to think critically and ensure fairness and reasonableness were at the heart of everything we do, from complaint-handling and stakeholder engagement to public awareness.

Howard’s ability to distill complex issues and remain focused on practical solutions earned the respect of colleagues and stakeholders alike. His commitment to building a strong, values-driven corporate culture set a tone that will continue to guide us.

We will especially miss the personal touches that made Howard’s leadership so memorable. He connected with staff at every level. His genuine interest in our families and lives made us all feel seen, heard, and valued.

As Howard embarks on his next chapter, we offer our deepest gratitude and best wishes.

With appreciation,
The CCTS Leadership Team, on behalf of all staff

Year at a glance

Annual Report

August 1, 2024 – July 31, 2025

This section provides an overview of significant data points and events for the Commission for Complaints for Telecom-television Services (CCTS) between August 1, 2024 and July 31, 2025.

By the numbers

Record number of complaints

For the third consecutive year, the CCTS responded to a record-high volume of complaints.

Increase in complaints

23,647 complaints were accepted, up 17% from last year.
22,094 complaints were concluded, up 15% from last year.

Concluded complaints

86% of concluded complaints were successfully resolved.
21% of concluded complaints required conciliation or investigation.

Number of issues

43,397 issues were raised in 22,094 concluded complaints.

Industry-wide participation in the CCTS

305 service providers representing 427 brands.

Distribution of complaints

96% of all complaints were about 25 service providers.
92 brands received 3 or fewer complaints.
255 brands received no complaints.

Top issues raised

Wireless issues were the most frequently reported again this year, representing 51% of all issues.
Issues about incorrect charges for monthly price plans remained the most-raised issue across all lines of business (wireless, internet, phone, and TV).

Key events

  • We advanced our five-year strategic plan (2024–29) by delivering tangible progress across all three priority areas: service excellence, stakeholder value, and organizational effectiveness.
  • We met or exceeded most of our complaint-handling target performance standards, despite a significant volume of accepted complaints last year and a continued, though smaller, increase this year. We:
    • accepted over 95% of complaints within three business days
    • concluded 85% of all complaints within 60 days
    • continued to focus on improving the efficiency of the investigation stage, which remains more time sensitive and accounts for around 5% of all concluded complaints
  • We continued to refine our complaint-handling process and technology, and sought opportunities to better serve our stakeholders.
  • In October 2024, we launched our Investigation Findings Library to promote greater transparency about the way we deal with complaints, the issues they raise and our decision-making process. Since then, we have published nearly 100 new findings and received positive feedback.
  • We continued to expand our public awareness activities, reaching more consumers across Canada through media relations, radio, digital campaigns, and social media. This year, we added podcast advertising. Our awareness work led to greater media coverage, higher website traffic, and a broader reach across Canada. These efforts helped telecom and TV customers better understand who we are and how to access our services when needed.
  • We made progress on accessibility, one of our key operating principles. We consult annually with accessibility groups to gather feedback about the accessibility of our services. We published an updated Multi-Year Accessibility Plan and Integrated Accessibility Policy. We monitored and assessed our website’s compliance with Web Content Accessibility Guidelines to provide a more inclusive digital presence for all website visitors. This work includes manual and automated scans of our web pages to identify and remove barriers that could negatively impact the user experience. We made accessibility improvements to our online customer complaint form, in response to stakeholder feedback and our website scanning work.
  • In November 2024, the Canadian Radio-television and Telecommunications Commission (CRTC) reminded providers about their responsibility to inform customers about the CCTS and stated its view that Canadians are not being made aware of the CCTS effectively. The CRTC also reminded providers about the importance of the CRTC’s consumer protection codes and began launching consultations to build on these protections.
  • Over the past year, we offered input on several CRTC regulatory proceedings about making pricing and service information clearer and more transparent for customers. We shared insights from our complaint-handling and Code administration perspectives. These contributions reflect our ongoing efforts to use insights from complaints to improve the system for everyone and to help inform broader policy change.
  • We met with 15 consumer advocacy groups and accessibility organizations to deepen our stakeholder relationships. Their insights help us identify barriers in service accessibility and complaint resolution and inform our awareness efforts in this area.
  • We continued to support and engage service providers to ensure they understand our complaint-handling process, technology requirements, and compliance requirements.
  • We welcomed 14 new Participating Service Providers (PSPs) to the CCTS. We also terminated the participation of 15 service providers that went out of business or no longer provided in-scope telecom services.
  • Our teams continued to engage with PSPs about the steps they need to take to remain in good standing with the CCTS, including cooperating in the complaint-handling process, informing their customers about the CCTS, and paying their CCTS fees. We worked with non-compliant PSPs to rectify outstanding non-compliance, particularly with provider obligations to promote awareness of the CCTS to their customers.

Who we are and what we do

Annual Report

August 1, 2024 – July 31, 2025

Our mandate

The Commission for Complaints for Telecom-television Services (CCTS) is Canada’s national ombuds for the telecommunications and television sectors. We are an independent, not-for-profit organization. We help resolve customer complaints about wireless, internet, TV, and phone services — fairly and free of charge.

The CCTS works with over 400 service provider brands across Canada. Customers can turn to the CCTS for help when they are unable to resolve issues directly with their provider.

Since 2007, we have resolved more than 200,000 complaints from individual customers and small businesses. Most complaints are resolved at the early stages of our process where customers and providers work together to try to find a solution.

We have the authority to address a wide range of issues about billing, contract disputes, and service delivery. We can require service providers to:

  • correct billing errors
  • issue refunds or credits
  • waive fees or charges when they are not valid under the customer’s contract or applicable codes
  • apply discounts or promotions when they were promised but not honoured
  • update or correct credit reports if incorrect information was sent to a credit bureau
  • restore service suspensions or cancellations that were done in error

The complaint data we collect and share offers insights about current and emerging issues. Our transparent reporting is intended to foster industry-wide customer service enhancements, highlighting areas for improvement and encouraging positive industry change.

Services in our mandate: 1. Internet 2. Wireless, including voice, data and text 3. TV, for residential customers only 4. Phone, for home and small business, including long distance, white page directories, directory assistance and operator services

“I was very impressed with the prompt and excellent service from the CCTS. My rights were upheld, and my complaint was handled efficiently. I received the remedy that I needed. Thank you very much for your excellent service!”

Customer who used the CCTS’ services in 2024–25

Our complaint-handling process

When customers have a problem, they must try to sort it out first with their provider. If that doesn’t work, they can file a complaint with us.

Our first step is to check if we can help with the issue raised in a complaint. When an issue falls within our mandate, we work to resolve it quickly. This often happens at the early stages of our complaint process by facilitating fair agreements between the two sides.

Step 1: Complaint Submission & Assessment; Step 2: Initial Referral; Step 3: Conciliation and Investigation; Step 4: Outcome

Visit Complaint Resolution Process Explained on our website for more details.

Our vision, mission, and values

In 2024, we launched a new five-year strategic plan to enhance complaint handling, improve service delivery, and strengthen relationships with stakeholders.

Vision: Exceptional complaint resolution that strengthens Canada’s telecommunications and television landscape.

Mission: To provide impartial, fair, and effective complaint resolution services, data, and insights to telecommunications and television consumers and service providers.

Values: Excellence, integrity, resolution-driven, collaboration, and respect. We are committed to delivering accessible, unbiased, and effective dispute resolution for consumers across Canada.

2024-25 Complaints

Annual Report

August 1, 2024 – July 31, 2025

This section highlights the overall volume and nature of complaints received during the 2024–25 fiscal year. It sets the stage for the more detailed analysis that follows in the report. For definitions of the terms used in this section, see the Glossary of Terms.

About our data

The statistics in this report reflect the complaints we received, accepted and concluded this fiscal year, from August 1, 2024 to July 31, 2025. The complaints accepted or concluded after July 31, 2025 will be reported in subsequent Annual Reports.

NOTE:  A single complaint may raise more than one issue, so the number of issues is higher than the number of complaints. To ensure accuracy, we audit the data throughout the year. Percentages are rounded for clarity, which means totals in some tables may not add up to 100%.

Complaint statistics

Table 6.1: Summary of operational statistics

Billing issues – 20,108; Service delivery - 10,849; Contract dispute – 10,688; Credit management – 1,672; Other - 80

Table 6.2: Leading complaint issues broken down by service type

* The number of issues is higher than the number of complaints accepted because a single complaint may raise more than one issue.

† Other services include long distance, operator service, directory assistance, and white pages directories issues.

** Other issue types include accessibility-related issues that fall within our mandate.


23,647 accepted complaints and 43,397 issues

Analysis

The overall number of issues increased by 12% compared to last year. Our analysis of complaints found that:

  • wireless services once again generated the largest number of issues across all service types, accounting for 51% of all issues
  • TV service issues increased by 44% overall, with TV contract dispute issues contributing the most to this increase (up 77% compared to last year)
  • billing issues remained the most common issue across all service types
  • contract disputes surpassed service delivery issues to become the second most common issue type, increasing by 17% compared to last year

Consult the Topics and trends section of our Annual Report for more details about complaints and issues.

Topics & trends

Annual Report

August 1, 2024 – July 31, 2025

Overview

Between August 1, 2024 and July 31, 2025, the CCTS accepted 23,647 complaints from customers across Canada. This represents a 17% increase from last year and is the highest number of complaints accepted in our organization’s history. 86% of concluded complaints were successfully resolved. Most resolved complaints were settled within 20 days.

This year, we concluded a record-breaking 22,094 complaints containing 43,397* issues.

* A single complaint can contain more than one issue. For example, a customer may submit one complaint about both the billing of their internet service and roaming charges related to their wireless service. These would be reported as two issues.

23,647 accepted complaints, 17% increase from last year

Understanding the landscape of issues

Before taking a closer look at complaint trends, it is helpful to see the overall distribution of issues raised across all service types (wireless, internet, TV, and local phone). The chart below highlights the top 10 issues in 2024–25, showing the volume, share of issues across all service providers, and year-over-year (YoY) change. For a full list of issues raised, see Appendix B: Detailed analysis of issues raised in complaints.

Table 7.1: Top 10 issues across all service types

Note: In charts throughout this report, year-over-year increases are shown in red, and year-over-year decreases are shown in green.


The top 10 issues appear in the same order as last year, apart from breach of contract, which replaces repair issues and appointments in sixth place. Notable increases occurred with contract-related issues, such as breach of contract and changes to the contract, which rose by 121% and 34%, respectively.

Issues related to billing and credit also continued to grow, including:

  • regular price increase of monthly price plan: 61% increase
  • third-party credit reporting: 27% increase
  • termination fee: 33% increase

This snapshot provides context for the trends that follow, showing how these issues fit within the broader complaint landscape.

Interpreting the numbers: Insights and emerging trends

Trend 1: Billing issues, on the rise again, remain a top concern for telecom and TV customers

Incorrect monthly charges and missing credits account for the highest volume of billing issues

Billing issues often arise from unclear communication, which can lead to customer confusion or unmet expectations. Billing continues to make up the largest share of issues across all service types. This year, billing issues account for 46% of issues raised, up from 45% last year.

After a decline in 2022, the volume of billing issues rose by 52% in 2023–24, with a further increase of 16% this year. The 20,108 issues (see Figure 7.1) raised represents the highest number of billing issues reported in the last five years and the second highest ever recorded by the CCTS. The resurgence of billing issues comes at a time when Canadian consumers face increasing cost of living and prices for goods and services. This may help explain why people may be more concerned about any billing discrepancies, and may be paying closer attention to their household spending, including their telecom and TV bills.

Figure 7.1: Five-year view of billing issues

Billing remains a top concern for internet customers, 16% increase from last year

Key messages

To avoid misunderstandings, customers should ensure that all offer details (such as the monthly price and how long the price is set) are clearly documented in writing and match what appears on your service agreement. Review your contract and contract summary soon after entering into the agreement. Contact your provider quickly if it does not match what you agreed to. You may have the right to cancel the contract without penalty if you point out any mismatch quickly or do so during a trial period.

Four top billing issues stand out across service types:

  • Incorrect charges for monthly price plans: accounts for 30% of all billing issues (up 6% year over year).
  • Credit or refund not received: accounts for 9% of all billing issues (up 8% year over year).
  • Regular price increase of monthly price plan: accounts for 7% of all billing issues (up 61% year over year).
  • Billing issues related to rental equipment enters the top 10 list, with a 982% increase (552 issues this year, compared to 51 issues in 2023–24).

Three of the top 10 issues across all service types are related to billing. The increase in billing issues is consistent across all service types. For TV services, this marks the second consecutive year of increases. After five years of decline, billing issues related to TV rose by 61% last year, followed by a further 59% increase this year. TV-related billing issues now account for 14% of all billing issued reported (up from 11% proportionally last year).

  • Wireless billing issues: 13% increase
  • Internet billing issues: 9% increase
  • TV billing issues: 59% increase
  • Local phone billing issues: 9% increase
Table 7.2: Top 10 billing issues
Issue Number
Incorrect charge for monthly price plan 6,001
Credit or refund not received 3,964
Regular price increase of monthly price plans 2,930
Equipment charges 1,009
Deactivation charges/billed after cancellation 779
Invoices not received 692
Misapplied payments 644
Roaming charges 599
Installation, activation, or reactivation charges 581
Rental equipment 552

The number of TV billing issues increased by 59% this year

Figure 7.2: Proportion of billing issues across service types
Table 7.3: Billing issues – Top 10 service providers

* The average billing resolution rate was 87%.


TELUS’ billing issues rose sharply for the second consecutive year, up 82% year over year after a 56% increase last year. Bell also saw a 22% increase in billing issues, an increase for the second year in a row.

Rogers/Shaw accounts for the highest portion (29%) of billing issues across all service provider brands. Of note, the CCTS combined the Rogers and Shaw brand data into a single brand in this Annual Report, called “Rogers/Shaw.” This reflects the integrated branding of “Rogers together with Shaw.” All year-over-year data comparisons for Rogers/Shaw are compared to combined Rogers and Shaw brand data points from last year.

Case Summary

Billing case summary: Incorrect charges for suspended monthly service plan

A customer filed a complaint with the CCTS stating they were incorrectly billed by their provider for their recurring monthly internet service plan.

We worked with the customer and the service provider to clarify the facts and help resolve the issue. The customer supplied copies of their invoices and explained that their internet service, which was on a month-to-month plan, had been suspended for non-payment but that the provider continued to bill them for service for an additional six months. The additional payments totaled $254.

We worked with the provider to review account billing records and supporting evidence. The service provider was unable to produce any supporting documentation, such as a copy of the agreement, call notes, or invoices showing how the $254 charge was calculated. Our review of the provider’s Terms of Service found no provision allowing it to continue charging a customer during a service suspension, leading us to conclude that these charges were improper.

After reviewing all the evidence and correspondence from both parties, we determined that the service provider failed to meet its obligations to the customer regarding billing practices. Therefore, we required the provider refund $254 to the customer for the improper service charges.


Key takeaway for customers

Keep a copy of all signed agreements and communications with your provider (such as chat transcripts or emails). These can be helpful if there is ever a misunderstanding or an error. Always reach out to your provider promptly if you notice unexpected charges or changes. We can help you if you feel your provider has not followed the rules and you’ve been unable to solve the issue with them.


Key takeaway for providers

Ensure your billing system automatically halts recurring charges when an account is suspended or terminated.  Transparency helps prevent misunderstandings and reduce customer frustration. Clear documentation showing when suspension and cancellation occur is essential to demonstrate that charges are valid. Continuing to bill for cancelled services is not permitted and can lead to disputes.

Trend 2: Contract breach issues increased significantly

Contract breach issues increased significantly and often as part of other billing or contract dispute issues

Contract disputes made up 25% of all issues this year. Most of these issues arose when the disclosure of contract terms was unclear, the written agreement conflicted with what the customer agreed to, the provider changed the contract, or the customer and provider disagreed about whether the provider performed its contractual obligations to the customer.

The number of contract dispute issues increased by 17% this year. Of the 10,849 contract dispute issues raised in 2024–25:

  • 60% related to compliance with the provider’s terms of service or contract, such as changes to the agreement, breach of contract, termination fee, and compliance with device financing plans.
  • 40% were disclosure-related issues, including where the contract conflicted with the agreement, no consent to the agreement, unclear rules, or disclosure of device financing terms.
Table 7.4: Top contract dispute issues
Issue Number Proportion Year-over-year (%)
Disclosure issues 4,303 40% -16%
Breach of contract 2,352 22% +121%
Changes to the contract 2,316 21% +34%
Termination fee 1,480 14% +33%
Device financing 298 3% +61%
Renewal of contract 100 1% +18%
Figure 7.3: Five-year view of contract dispute issues

The following are notable observations about contract disputes this year:

Breach of contract

Customers raised more issues this year about their provider not honouring the terms of their contract. Service providers are required to follow their own terms of service, agreements with customers, and any specific offers they have made to a customer. Breach of contract issues can include promised features that were missing, or the provider making an error or taking an action that the customer considers to be a breach of the contract for their agreement or terms of service. These types of concerns, known as contract breach issues, saw a significant 121% increase in the number of issues raised. Breach of contract issues became a top 10 issue this year; this was the sixth most-raised issue.

Complaints containing breach of contract issues often involve additional issues. In fact, 78% of complaints that raised a breach of contract issue that the CCTS investigated also identified one of four related billing or contract issues: incorrect charge for monthly price plan, disclosure issues, credit or refund not received, and regular price increase of monthly price plan.

This overlap in issues is an example of how contract disputes rarely occur in isolation. They are often part of a broader customer concern such as a billing problem that becomes a contract dispute, or vice versa. Analyzing the overlap between breach of contract issues and related complaints helps us better understand both the root cause and the opportunity for providers to avoid contract disputes by improving clarity in communications or ensuring compliance with what was agreed to.

Breach of contract issues, 121% increase from last year

Case Summary

Contract dispute case summary: Contract changed without consent

A customer complained to the CCTS that their internet contract was changed several times over a five-month period without consent, leading to higher costs. The customer contacted the CCTS after their attempts to resolve the contract dispute with their provider were unsuccessful.

When there’s a dispute about what the customer agreed to, we ask the provider to show evidence of the agreement and that it was delivering the agreed-upon services. If the agreement was changed, the provider must also show that it had the right to make those changes and that it followed all necessary steps, such as obtaining consent or providing proper notice to make the change effective.

As part of our complaint investigation, we analyzed billing records, copies of the contract, the provider’s internal system and its account notes for evidence of consent. We also reviewed the customer’s invoices to confirm how charges and credits were applied.

We found that the customer had initially agreed to a 2-year fixed-term contract. The agreed-upon price for the 2-year contract was $66 per month. The provider is subject to the Internet Code, and it does not allow the provider to change terms of the fixed-term contract without the customer’s consent. The provider gave the CCTS a copy of a month-to-month contract, but could not demonstrate that the customer had agreed to change from a fixed-term agreement to a month-to-month agreement. The customer’s invoices showed that the provider had increased the monthly price by $5 per month. Account notes showed no record that the customer was informed of these changes, and the provider could not supply call recordings to prove that the customer had consented.

The CCTS determined that the provider failed to meet its obligations because it failed to notify the customer about the contract change, and failed to get the customer’s consent for the changes. Therefore, the provider was not permitted to change the customer’s monthly service price. The CCTS required the provider to restore the customer’s internet plan to the terms originally agreed upon and to issue a credit for amount the customer was overcharged. In addition, we required the provider to compensate the customer for the inconvenience caused.


Key takeaway for customers

When you sign up for a plan, ask the provider if the terms of service allow them to increase prices or add service charges. If your provider is subject to a CRTC consumer protection code, they may not be allowed to change the price during the fixed-term agreement without your consent. When you agree to a service, be sure to carefully review the documents from your service provider so there are no surprises later. Ask questions if the information is unclear.


Key takeaway for providers

Always obtain and document clear, informed consent from customers before making any changes to their services or contracts. Verbal agreements should be supported by written confirmation, ensuring the customer fully understands and agrees to the changes. This helps prevent disputes and demonstrates compliance with CRTC requirements.

Disclosure issues

Although we saw a decrease in disclosure issues this year, this continues to be the most-raised contract dispute problem and the second most common issue overall. It is the only issue within the top 10 issues list that decreased from last year. Customers raised 4,303 disclosure issues across all service types this year — a 16% decrease from last year.

Figure 7.4: Five-year view of disclosure issues
Figure 7.5: Disclosure issues by type of service

Wireless customers continue to account for most disclosure complaints, making up 57% of all disclosure issues.

Device financing plans

In 2021, the CRTC ruled in a decision that device financing plans fall under the scope of the Wireless Code. The CRTC found that requiring customers to pay the balance of a device financing plan constitutes an early cancellation fee. To inform future reviews of the Wireless Code, the CRTC asked us to track related complaints in our Annual Reports.

For the second year in a row, we saw an increase in device financing plan issues, up 36% year over year (from 328 to 447 issues).

Customers raise these issues in two ways:

  • Disclosure of device financing terms: when customers say the service provider did not clearly or accurately inform them about its device financing plan (33% of device financing plan issues).
  • Compliance with device financing terms: when customers say the provider did not follow the agreed-upon device financing plan, such as charging the customer the wrong monthly device subsidy or continuing to charge the monthly device subsidy after the device has been fully paid for (67% of device financing plan issues).
Table 7.5: Issues with device financing plans for wireless services

* The overall resolution rate was 85.3%.

Trend 3: Customers continue to report service quality and reliability issues

Volume of service delivery issues declined slightly compared to last year

Service delivery issues are problems with the quality, reliability, and management of a customer’s service. These issues, which account for 25% of all issues raised in 2024–25, include the following:

  • intermittent service (e.g. slower-than-expected broadband or wireless speeds)
  • complete loss of service
  • delays to install or cancel services
  • difficulties cancelling or porting services

While the overall number of these issues increased this year, the proportion of service delivery issues decreased slightly (down 2%) from last year.

Service delivery issues account for 25% of all issues raised in 2024–25

Figure 7.6: Five-year view of service delivery issues
Figure 7.7: Service delivery issues by service type

Wireless and internet services account for the largest portion of service delivery issues at 41% and 34%, respectively. We saw a decrease in service delivery issues across service types, except for TV service, which saw a 3% increase in service delivery issues year over year. Overall service delivery issues dropped 2% year over year.

Table 7.6: Top 10 service delivery issues 


Service delivery issues decreased this year, following three consecutive year-over-year increases. Some Top 10 service providers saw considerable increases in service delivery issues. Notably, Chatr (+274%), TELUS (+47%), and Fizz (+46%) saw considerable increases in service delivery issues.

Table 7.7: Service delivery issues – Top 10 service providers

* The average service delivery resolution rate was 82.5%.

Case Summary

Service delivery case summary: Ongoing internet quality of service on a five-year contract

A small business customer signed a five-year contract with a provider for internet service with download speeds up to 50 Mbps. The customer filed a complaint with the CCTS claiming ongoing intermittent quality of service issues since the start of service.

We reviewed the details of the complaint, the evidence provided by the customer, and the response from the service provider. We worked with the customer to better understand the consistent connectivity problems from the start of the service. We learned through conversations with the customer that their main concern was being locked into a five-year contract despite poor service.

The customer wanted to cancel their services with the provider without incurring a penalty; however, the customer and provider were unable to reach an agreement during our Conciliation process. The CCTS investigated the complaint to formally assess whether the provider met its obligations to the customer.

During the Investigation stage, we reviewed all evidence thoroughly and requested additional documentation to examine the matter in detail. In this case, internet speed test reports revealed that the customer’s download speeds were less than half of the promised level. The customer provided us with evidence of multiple unresolved service tickets. Despite this, only one service ticket was found in the PSP’s system, and the service ticket was closed, despite the problem not having been resolved. We found that the provider’s internal troubleshooting documentation was incomplete.

Our investigation found that the provider could not demonstrate that it had followed its troubleshooting policy to correct the service issue. As such, the customer had not received the level of service promised by the service provider. We issued an Investigation Finding explaining our analysis and required the provider to release the customer from the five-year contract without penalty, as the provider failed to deliver the contracted service quality and fulfill its troubleshooting obligations.


Key takeaway for customers

Review all terms regarding service standards before signing a long-term contract. Document and retain details of all service issues, including any speed test results, communications with your provider, and their troubleshooting efforts for future reference.


Key takeaway for providers

Thoroughly investigate the root cause of any mismatch between your advertised offers and the actual service quality experienced by the customer. Don’t rely solely on the part of your Terms of Service that says you’re not responsible for service interruptions. Instead, work with your customers to troubleshoot the problem and see if there’s a gap in service quality. If there is, take the time to understand the reasons behind it and collaborate with your customer to find a reasonable solution. If a customer is not experiencing the expected service quality, we examine whether you have followed your process to correct the service quality issue, and whether a failure to fix the issue should result in some other form of remedy, including credits.

Trend 4: Credit reporting issues increased for the second year in a row

Credit reports can affect financial health, career opportunities, and access to credit

While credit management issues account for a small share of total issues, these can have a significant potential impact on customers. When a provider makes a negative report to a third-party credit bureau, it can affect the customer beyond their telecom and TV services. Credit reports can impact a customer’s financial standing, employment, or access to credit. In these cases, a customer may submit a complaint that their provider improperly reported their account to a collection agency or credit bureau. These are often disputes over how the provider handled the customer’s credit information and how it affected their credit history.

Credit management issues account for 4% of all issues raised in 2024–25. Of these complaints, 59% of issues are attributed to wireless services, 27% to internet, 9% to TV, and 5% to phone services.

90% of credit management issues related to third-party credit reporting

For the second year in a row, we saw an increase in credit management issues. This was a 22% increase from 2023–24. Third-party credit reporting represents 90% of credit management issues and increased by 27% year over year.

The remaining 10% of credit management issues are about credit deposits or limits. These include security deposit requirements, amounts, refunds, and interest.

Figure 7.8: Five-year view of credit management issues
Figure 7.9: Third-party credit reporting issues
by service type

Case Summary

Credit management case summary: Improper credit report on closed account

A customer filed a complaint with the CCTS, stating that their wireless provider had reported their unpaid account to a credit agency, but the customer believed their payments were up to date. The customer contended that this action negatively affected their credit score.

The CCTS contacted the customer to ensure they understood our neutral role and to explain our process. We also reached out to the service provider to clarify its position and gather necessary evidence.

The customer told us that they had requested to port their number to another provider. The customer said that several representatives from their previous provider had confirmed they owed nothing for the closed account, but the provider’s records did not support that claim.

We reviewed the monthly invoices for the period in question, noting that an email was sent to the customer outlining what they should expect on the final bill, including any prorated recurring monthly charges remaining for the account. After the account was adjusted for the remaining service period, a small balance remained, which the customer did not originally pay.

We also reviewed the Customer Service Agreement, which states that the customer permits the provider to share credit information, including payment history, with consumer reporting agencies at any time. The CCTS found that the provider had acted in accordance with these terms and met its contractual obligations. The provider was within its rights to report the unpaid balance to credit bureaus once the account became delinquent. However, in this case the provider demonstrated that they did not refer the customer to a third-party collection agency or to a credit bureau.

Therefore, we found that the provider met its obligations to the customer. We further noted in our Investigation Finding that the customer had since paid the final balance owed to the provider.


Key takeaway for customers

Always monitor your account activity and make payments for services rendered in a timely manner. Keep copies of all correspondence and payment confirmations. This can help prevent misunderstandings and protect your credit record from inaccurate reporting. Remember that a final invoice that isn’t fully paid can still result in late payment fees being accrued on your account. Outstanding balances can result in collections and credit bureau actions by your provider.


Key takeaway for providers

Be clear with your customers about credit checks, deposits, and payment terms. Seek consent before checking or reporting credit, and give notice before sending any report to a credit bureau. Inaccurate or unjustified credit reporting can be very damaging to a customer, so caution is warranted. It can also lead to corrective action and potential compensation for customers. Clear communication and fair treatment help avoid misunderstandings and build trust.

Spotlight on services

While themes like billing, contracts, service delivery, and credit management show types of problems consumers face, this section shows how these issues map to wireless, internet, TV, and phone services. This helps identify where customers’ pain points are concentrated and whether certain services consistently generate a higher complaint volume or specific types of issues.

This year, there was a notable increase in issues pertaining to TV services. While issues across other service types grew between 4 and 9%, issues related to TV services increased by 44% this year.

Figure 7.10: Five-year view of issues by service type
Table 7.8: Number of issues by service type, year-over-year (YoY) change

Wireless services

Wireless continues to be the most complained about service, accounting for 51% of all issues. Wireless issues increased by 9%, from 20,161 issues to 22,020 issues. There were more wireless issues raised this year than in any of the last five years.

Billing remains the top category of issues for wireless services, with an increase of 13% from last year.

Wireless service delivery issues increased marginally by 0.5% from last year, and wireless contract dispute issues increased by 7%. Wireless disclosure issues decreased by 17%. Table 7.9 shows the key issues that increased year over year and contributed to the overall rise in wireless issues.

Issues by service type: Wireless 51%, Internet 27%, TV 14%, Local phone 8%

Within the Top 10 wireless issues categories, the following issues were the primary contributors to the overall increase in wireless issues:

  • breach of contract issues: 80% increase
  • regular price increase of monthly price plan: 53% increase
  • third-party credit reporting: 27% increase
  • credit or refund not received issues: 14% increase
Figure 7.11: Five-year view of wireless issues
Table 7.9: Top 10 wireless issues
Issue Number Proportion Year-over-year (%)
Incorrect charge for monthly price plan 3,061 14% +8%
Disclosure issues 2,443 11% -17%
Credit or refund not received 2,415 11% +14%
Quality of service 1,599 7% +10%
Breach of contract 1,361 6% +80%
Changes to the contract 1,199 5% +15%
Regular price increase of monthly price plans 1,179 5% +53%
Third-party credit reporting 917 4% +27%
Roaming charges 599 3% +3%
Complete loss of service 581 3% +13%

Internet services

Internet issues account for the second-largest volume of issues across service types, with 27% of all issues raised by customers this year.

The number of internet issues increased by 7% this year, after a 50% increase in 2023–24. The most-raised internet issue is incorrect charge for monthly price plan, representing 14% of all internet issues, down 1% in share.

These are the primary contributors to the rise in internet issues:

  • regular price increase of monthly price plan: 42% increase
  • termination fees: 49% increase
  • breach of contract: 182% increase

Internet issues related to quality of service and disclosure saw decreases; however, these issues continue to represent a large portion of internet issues: 10% and 9%, respectively.

Figure 7.12: Five-year view of internet issues
Table 7.10: Top 10 internet issues
Issue Number Proportion Year-over-year (%)
Incorrect charge for monthly price plan 1,682 14% +3%
Quality of service 1,177 10% -5%
Disclosure issues 1,081 9% -13%
Credit or refund not received 975 8% -2%
Regular price increase of monthly price plans 886 7% +42%
Termination fee 701 6% +49%
Complete loss of service 585 5% -4%
Due dates not kept or delay for installation or cancellation of service 539 5% +7%
Breach of contract 530 4% +182%
Repair issues and appointments 453 4% -36%

TV services

Issues about TV services are at a five-year high this year, with a 44% increase following a 47% increase last year. TV issues represent 14% of all issues raised, up from 11% last year.

Notably, TV billing issues increased by 59% from last year. TV customers raised more issues about incorrect charges for monthly price plans (17% increase) and regular price increase of monthly price plan (152% increase), as well as a significant increase in rental equipment charge issues.

TV customers raised more contract disputes (43% increase). These were largely about changes to the contract and breach of contract, which saw a 212% and 388% increase, respectively.

44% increase in TV services issues, highest in last 5 years

Figure 7.13: Five-year view of TV issues
Table 7.11: Top 10 TV issues
Issue Number Proportion Year-over-year (%)
Incorrect charge for monthly price plan 791 13% +17%
Changes to the contract 587 10% +212%
Regular price increase of monthly price plans 574 9% +152%
Disclosure issues 506 8% -6%
Quality of service 502 8% +18%
Rental equipment 502 8% +2,689%
Credit or refund not received 366 6% +5%
Breach of contract 317 5% +388%
Unable to cancel 229 4% +48%
Termination fee 215 4% +75%


Phone services

Local phone services account for 8% of all issues, proportionally unchanged year over year. The number of issues raised about local phone services increased by 5% this year.

Billing issues and contract disputes increased by 9% and 8%, respectively. Notable phone issue increases included:

  • regular price increase of monthly price plan: 60% increase
  • unable to port: 33% increase
  • breach of contract: 178% increase
  • termination fee: 14% increase
Figure 7.14: Five-year view of phone issues
Table 7.12: Top 10 phone issues
Issue Number Proportion Year-over-year (%)
Incorrect charge for monthly price plan 437 13% -6%
Regular price increase of monthly price plans 288 9% +60%
Complete loss of service 283 9% 0%
Disclosure issues 266 8% -21%
Quality of service 262 8% +6%
Credit or refund not received 196 6% +3%
Unable to port 190 6% +33%
Breach of contract 142 4% +178%
Repair issues and appointments 139 4% -24%
Termination fee 129 4% +14%


Figure 7.15: Incorrect charges for monthly price plan by service type

Figure 7.16: Credit or refund not received issues by service type

Figure 7.17: Regular price increase of monthly price plans by service type

Figure 7.18: Disclosure issues by service type

Figure 7.19: No consent or contract conflicts with agreement by service type

Figure 7.20: Rules related to agreement are unclear issues by service type

Figure 7.21: Changes to the contract issues by service type

Figure 7.22: Breach of contract issues by service type

Figure 7.23: Termination fee Issues by service type

Figure 7.24: Quality of service issues by service type

Figure 7.25: Complete loss of service by service type

Figure 7.26: Contract dispute issues by service type

Top complaint issues by service provider

In this Annual Report, the CCTS combined the Rogers and Shaw brand data into a single brand, called “Rogers/Shaw.” This reflects the integrated branding of “Rogers together with Shaw.” All year-over-year data comparisons for Rogers/Shaw compare to combined Rogers and Shaw brand data points from last year.

Table 7.13: Top billing issues by provider
Top billing issues Service provider Number of times issue was raised Proportion of issue
Incorrect charge for monthly price plan Rogers/Shaw 1,402 27%
TELUS 1,713 29%
Bell 1,052 16%
Credit or refund not received Rogers/Shaw 942 24%
TELUS 856 22%
Bell 808 20%
Regular price increase to monthly price plan Rogers/Shaw 969 33%
TELUS 660 22%
Bell 548 19%
Table 7.14: Top contract issues by provider
Top contract issues Service provider Number of times issue was raised Proportion of issue
No consent or contract conflicts with agreement Rogers/Shaw 1,182 31%
TELUS 1,044 28%
Bell 597 16%
Breach of contract Rogers/Shaw 682 29%
TELUS 599 25%
Bell 410 17%
Changes to the contract Rogers/Shaw 983 42%
TELUS 402 17%
Public Mobile 244 11%
Rules related to the agreement are unclear Rogers/Shaw 138 36%
TELUS 72 19%
Bell 43 11%
Termination fee Rogers/Shaw 624 42%
TELUS 328 22%
Bell 242 16%
Table 7.15: Top service delivery issues by provider
Top service delivery issues Service provider Number of times issue was raised Proportion of issue
Quality of service Rogers/Shaw 847 24%
TELUS 747 21%
Bell 698 20%
Complete loss of service TELUS 300 18%
Rogers/Shaw 341 20%
Bell 326 19%
Unable to cancel Rogers/Shaw 284 24%
TELUS 266 23%
Public Mobile 183 16%
Due dates not kept or delayed for installation or cancellation of services Rogers/Shaw 229 20%
TELUS 235 21%
Bell 203 18%
Table 7.16: Top credit management issues by provider
Top credit management issues Service provider Number of times issue was raised Proportion of issue
Third-party credit reporting TELUS 466 30%
Rogers/Shaw 398 25%
Bell 234 15%
Table 7.17: Disclosure issues – Top 10 service providers

* The average disclosure resolution rate was 87%.

Reporting on CRTC consumer protection Codes of Conduct

Annual Report

August 1, 2024 – July 31, 2025

The Canadian Radio-television and Telecommunications Commission (CRTC) consumer codes of conduct outline certain consumer rights and service provider obligations with customers. The codes empower consumers to make informed decisions about essential wireless, internet, and television services. The Commission for Complaints for Telecom-television Services (CCTS) administers the Code rules by ensuring that consumers who file complaints have obtained the benefit of these protections.

Overview of CRTC consumer protection codes of conduct

When the CCTS investigates customer complaints about telecom and TV services, we try to determine if the service provider reasonably met its responsibilities to the customer. The CRTC has issued four mandatory CRTC consumer protection codes of conduct that set minimum standards for service provider practices:

  • Wireless Code: Applies to individual and small business customers. A small business customer is defined as a business whose average monthly telecommunications bill is under $2,500. Large corporate and commercial accounts are not covered by the code.
  • Internet Code: Applies to all retail fixed internet access services, including cable, fibre, digital subscriber line (DSL), fixed wireless, and satellite provided by Canada’s 10 largest internet service providers and their brands and affiliates. Mobile wireless internet services are covered by the Wireless Code.
  • Television Service Provider (TVSP) Code: Applies to residential subscription TV services provided by licensed TV service providers and their brands and affiliates.
  • Deposit and Disconnection (D&D) Code: Applies to residential home phone services. It sets out the rules for when providers can require a deposit, when they can disconnect a service, and what steps they need to take before they are permitted to disconnect a service.

To learn about how we administer the CRTC codes of conduct, watch the video below.

Resolving complaints and analyzing code compliance

When we accept a customer complaint, we record and track all the issues raised in the complaint. Some complaints raise questions about whether a provider has complied with a code of conduct. We call these “alleged breaches”.

The vast majority of complaints are resolved to the satisfaction of the customer and the provider at the initial stage of our process. When complaints are resolved, there is no need for us to investigate the underlying issues. This includes determining if there have been any violations of a code of conduct. Therefore, these issues remain “alleged breaches” and are categorized as “not requiring investigation”.

In the cases that we do investigate, we can determine whether there has been a code violation. We categorize proven violations as “confirmed breaches”.

One complaint may contain several confirmed breaches. These are some examples:

  • A code requirement was violated more than once.
  • A code violation affected more than one service or line associated with one customer account.
  • A complaint revealed violations of multiple provisions of a code.

When we investigate and determine that there has not been a violation, we categorize this as “no breach”.

Given that we investigate fewer cases to determine whether a code violation has occurred, we advise caution in the use of confirmed breach numbers for analyzing systemic compliance with codes. In 2024–2025, the CCTS concluded 22,094 complaints. The vast majority were successfully resolved by the customer and the service provider. We investigated 969 complaints in which a resolution could not be reached at the prior stages of our process, in order to determine whether the provider met its obligations to the customer. Confirmed code breaches from these investigations are detailed below.

Wireless Code

The Wireless Code aims to ensure that consumers of mobile voice and data services are better informed of the rights and obligations contained in their contracts. The Wireless Code makes it easier for individuals and small business customers to understand their wireless service contracts, to prevent bill shock from extra data and roaming charges, and to switch wireless providers easily. The Wireless Code applies to individual and small business customers. All wireless service providers must meet the Code’s requirements to customers.

Figure 8.1: Summary of Wireless Code breaches

From 2,957 alleged breaches, 2,817 alleged breaches did not require investigation and 140 breaches were investigated. Out of the 140 breaches investigated, 70 breaches were confirmed and 70 were not confirmed as a breach.

Summary of Wireless Code breaches

There were 70 confirmed breaches of the Wireless Code. This is an increase of 52%, from 46 confirmed breaches last year.

  • Clarity (Section A) and Contracts and related documents (Section B): These sections of the Wireless Code were the most breached requirements, with 22 confirmed breaches each. They each accounted for 31% of all confirmed wireless breaches with a significant year-over-year increase.
  • Clarity (Section A): Section A breaches increased from 3 to 22 this year. Of the breaches:
    • 11 were about the provider’s failure to communicate with customers clearly, accurately, or in a timely way
    • 9 were related to charges for services purchased on an unlimited basis
    • 2 were about the provider’s failure to ensure that the prices set out in the contract were clear and to indicate whether these prices include taxes
  • Contracts and related documents (Section B): Of the 22 Section B breaches:
    • 15 were about the provider’s failure to provide a permanent copy of the contract and related documents for the customer
    • 4 were about the provider’s failure to provide information about other aspects of the contract
    • 3 were about failure to include all key contract terms and conditions
  • Bill management (Section E): Section E breaches accounted for 14% of all confirmed Wireless Code breaches. Most of these breaches (7 out of 10) were about the provider’s failure to suspend data roaming charges once the cap threshold was reached.
  • Disconnection (Section I): There were 9 confirmed breaches to Section I. This is down from 24 confirmed breaches last year. Disconnection breaches accounted for 13% of all confirmed Wireless Code breaches.
Table 8.1: Wireless Code confirmed breaches by section

Note: In charts throughout this report, year-over-year increases are shown in red, and year-over-year decreases are shown in green.


Wireless Code confirmed breaches by service provider

TELUS had the greatest number of confirmed Wireless Code breaches and the largest increase in breaches, from 12 to 25. TELUS accounted for 36% of all confirmed breaches. The increase is mainly driven by the increase in breaches of Section B (Contracts and related documents).

Bell’s confirmed Wireless Code breaches increased from 10 to 19. Freedom Mobile also saw an increase in confirmed breaches, from 1 to 9. Both providers saw an increase in breaches of Section A (Clarity) for failure to communicate with customers clearly, in a timely way, accurately, and using plain language.

Rogers/Shaw had 6 confirmed breaches of the Wireless Code, up from 4 last year.

Table 8.2: Wireless Code confirmed breaches by service provider

Internet Code

The Internet Code was created so fixed internet access service customers are better informed of their rights and responsibilities, as detailed in their contracts with internet service providers (ISPs). The Internet Code aims to make it easier for individual customers to:

  • understand their internet service contracts
  • know when they will be charged fees and when prices will increase
  • switch internet service providers

The Internet Code applies only to individual customers; it does not apply to small business customers.

The Internet Code applies to large facilities-based ISPs and their brands and affiliates, which are listed in Table 8.3. However, when we investigate a complaint about an ISP to which the Internet Code does not apply, we may use the principles of the Code to guide us in determining what is good industry practice.

Summary of Internet Code breaches

There were 27 confirmed breaches of the Internet Code this year, up from 12 last year. The top confirmed breach areas were:

  • Section G (Contract cancellation and extension): 10 confirmed breaches, up from 0 last year (37% of confirmed Internet Code breaches)
  • Section F (Equipment issues): 6 confirmed breaches, up from 3 last year (22% of confirmed Internet Code breaches)
  • Section D (Changes to contracts and related documents): 4 confirmed breaches, same as last year (22% of all confirmed Internet Code breaches)
  • Section I (Disconnection): 3 confirmed breaches, up from 1 last year
Figure 8.2: Summary of Internet Code breaches

From 788 alleged breaches, 755 alleged breaches did not require investigation and 33 breaches were investigated. Out of the337 breaches investigated, 27 breaches were confirmed and 6 were not confirmed as a breach.

Table 8.3: Service providers governed by the Internet Code
Large facilities-based Internet service providers Related Internet brands and affiliates
Bell Canada
  • Acanac Inc.
  • B2B2C
  • Bell Aliant
  • Bell MTS
  • Cablevision
  • Distributel
  • Dryden Municipal Telephone System (DMTS)
  • EBOX
  • Kenora Municipal Telephone System (KMTS)
  • Maskatel
  • Northerntel
  • Northwestel*
  • Ontera
  • Oricom Internet
  • Primus
  • Réseau Picanoc.net (Maskatel)
  • Télébec
  • Téléphone de Saint-Éphrem
  • Téléphone de Saint-Victor
  • Téléphone Upton (Maskatel)
  • ThinkTel
  • Virgin Plus
  • Télécommunications Xittel
Cogeco Connexion Inc.
  • Cogeco Connexion (Ontario)
  • Cogeco Connexion (Quebec)
  • Cable Axion
  • Oxio
Eastlink
  • Amtelecom Limited Partnership
  • Coast Cable
  • Delta Cable
  • K-Right Communications Inc.
  • People’s Tel Limited Partnership
  • Persona Communications Inc.
Rogers/Shaw
  • Cable Cable Inc.
  • Compton Communications
  • Comwave
  • Cross Country TV
  • Fido
  • Kincardine Group
  • KWIC Internet
  • RuralWave
  • Seaside Communications Powered by Rogers
  • Seaside Wireless Communications Powered by Rogers
  • Source Cable
Sasktel
TELUS
  • ABC Communications
  • Altima Telecom
  • GTA Telecom
  • Mascon Cable
  • start.ca
Videotron Ltd.
  • Fizz
  • Freedom Mobile Inc.
  • VMedia
Xplore
  • Metro Loop

* Northwestel has two kinds of internet services: terrestrial (on land) and satellite. Northwestel’s terrestrial retail internet services are regulated by the CRTC, therefore out of the CCTS’ mandate and customers should forward their complaint to the CRTC. Northwestel’s satellite retail internet is not regulated by the CRTC, so the CCTS can accept complaints about these services.

Internet Code confirmed breaches by service provider

Rogers/Shaw accounted for 52% of all confirmed Internet Code breaches with 14 breaches, up from 1 last year. These breaches concern:

  • contract cancellation and extension problems (Section G)
  • equipment issues (Section F)

TELUS had 5 confirmed Internet Code breaches, up from 1 last year. Its breaches are related to its failure to provide required information about:

  • changes to contracts and related documents (Section D)
  • contracts and related documents (Section B)

This year, Altima was confirmed to have breached the Internet Code for the first time, with 3 breaches about:

  • its failure to clearly communicate with a customer (Section A, Clarity)
  • its failure to provide required information in contracts and related documents (Section B)
  • Critical Information Summary (Section C)
Table 8.4: Internet Code confirmed breaches by service provider

Television Service Provider Code

The Television Service Provider Code (TVSP Code) aims to make it easier for consumers to:

  • understand their television service agreements
  • be empowered in their relationships with TVSPs

The TVSP Code applies to individual customers. It does not apply to small business TV customers. All licensed TV service providers must meet the Code’s requirements. We address complaints about subscription TV services provided by cable, Internet Protocol television (IPTV), and national satellite direct-to-home (DTH) providers.

Figure 8.3: Summary of TVSP Code breaches

From 96 alleged breaches, 94 alleged breaches did not require investigation and 2 breaches were investigated. Out of the 2 breaches investigated, 0 breaches were confirmed and 2 were not confirmed as a breach.

TVSP Code confirmed breaches

There were no confirmed breaches of the TVSP Code this year, down from 4 breaches last year and 14 the year before.

Deposit and Disconnection Code

The Deposit and Disconnection Code (D&D Code) protects local phone customers when:

  • they are required to provide a deposit to obtain local phone service
  • a service provider intends to disconnect the customer’s local phone service

There were 8 confirmed breaches to the D&D Code this year, up from 5 breaches last year. Five of the 8 breaches were related to improper disconnection or no grounds for disconnection (Section 3.1).

Figure 8.4: Summary of D&D Code breaches

From 29 alleged breaches, 19 alleged breaches did not require investigation and 10 breaches were investigated. Out of the 10 breaches investigated, 8 breaches were confirmed and 2 were not confirmed as a breach.

Deposit and Disconnection Code confirmed breaches by service provider

Free Phone Line accounted for half of the confirmed breaches to the Deposit and Disconnection Code this year, with 4 confirmed breaches, up from 0 breaches last year. These breaches all relate to Free Phone Line’s failure to ensure it had proper grounds for disconnection.

Table 8.5: Deposit and Disconnection Code confirmed breaches by service provider

Working with service providers

Annual Report

August 1, 2024 – July 31, 2025

Our reports highlight the issues that customers encounter and have difficulty resolving with their service providers. By tracking and analyzing customer complaints, we identify recurring problems and broader trends across the telecom and television sectors. Reporting on issues at the service provider level not only gives consumers a clearer picture of their experiences but also helps inform providers about opportunities to better meet customer needs and to improve the customer experience.

This section of the Annual Report looks at the providers and brands that participate in the CCTS. It highlights changes among national provider groups and shows issue trends for the 10 most-complained-about brands.

The CRTC requires all wireless phone, internet, and licensed TV service providers in Canada to participate in the CCTS, so customers have recourse for complaints they cannot solve with their provider. If a service provider is not already a participant of the CCTS when one of their customers submits a complaint to us, they must join. A service provider that has joined the CCTS and agrees to follow our participation requirements is called a Participating Service Provider (PSP).


National PSP groups complaint analysis: five-year review

We track complaint share across national service provider groups. These groups represent the largest telecom and TV providers. They offer wireless service nationally to consumers as well as internet, phone, and TV service to large regions of Canada. These providers offer services to customers through various brands, subsidiaries, and affiliates. The national PSP group analysis aggregates complaints for all brands or companies that are commonly owned.

Table 9.1: National PSP groups and their brands
National PSP Group Brands
Bell group Bell Canada, Bell Aliant, Bell MTS, Virgin Plus, Lucky Mobile, Distributel, Acanac, Navigata, EBOX, Primus, Dryden Municipal Telephone System (DMTS), Kenora Municipal Telephone System (KMTS), PC Mobile (prepaid), Solo Mobile, Vox, Bell Satellite TV, Axia FibreNet, Télébec, Cablevision du Nord de Québec, Groupe Maskatel Québec S.E.C., NorthernTel, Ontera, Northwestel, 10-10-580, 450Tel, Telecommunications Xittel, Téléphone de St-Victor, Téléphone de St-Éphrem, Telephone Upton, ThinkTel, Unlimitel, Wintel, Yak, B2B2C, No Name Mobile, Oricom Internet
Rogers group Rogers/Shaw, Fido, Shaw Direct, Chatr Wireless, Source Cable Ltd., Simply Connect, Kincardine Group, Compton Communications, Cityfone, Cable Cable, Cross Country TV, RuralWave, Seaside Communications powered by Rogers, Seaside Wireless powered by Rogers, Zoomer, KWIC Internet, Comwave, Call Select, NetReach, Telizon Inc.
TELUS group TELUS Communications Inc., Koodo, Mascon, Public Mobile, TELUS Satellite, ABC Communications, Start.ca, Altima Telecom, GTA Telecom Inc., GoCo
Videotron group Videotron, Fizz, Freedom Mobile, VMedia

Note 1: In 2022–23, there was a significant amount of industry consolidation. Most notably, the Shaw and Shaw Direct brands were added to the Rogers group; Distributel, Acanac, Primus, and EBOX were added to the Bell group; and Start.ca and Altima Telecom were added to the TELUS group. Prior to 2022–23, these brands’ complaints were counted with “All other PSPs” separate from the national PSP groups.

Note 2: In 2023-24, we added the Videotron group to the national PSP groups. This is because it acquired Freedom Mobile which offers wireless services nationally.

Figure 9.1: Accepted complaints trend over four national PSP groups


Figure 9.2: Proportion of accepted complaints for the four national PSP groups
  • This year, total accepted complaints rose by 17% compared to last year. This increase is consistent with the upward trend seen across the four national PSP groups (Rogers, TELUS, Bell, and Videotron groups).
  • Together, the four national PSP groups account for 95% of all accepted complaints this year, a 2% increase compared to last year.
  • The Rogers group accounts for 38% of accepted complaints, which is the largest share of all national groups. The Rogers group saw an increase in accepted complaints of 15% this year.
  • Of the four national PSP groups, the TELUS group saw the largest increase in accepted complaints, up 38% since last year. This represents a sharp increase compared to the overall increase of 17%.
  • The TELUS brand was the largest driver within the TELUS group, with an increase of 78% more complaints accepted year over year. The TELUS group accounts for 27% of all accepted complaints, up from 23% last year.
  • The Bell group accounts for 23% of all accepted complaints, down 1% from the previous year. While its share of complaints declined, the Bell group saw an increase in complaints of 14% compared to last year.
  • Complaints about the Videotron group account for 7% of all accepted complaints, representing a 1% drop from last year’s report. We accepted 8% more complaints about the Videotron group this year, compared to a 17% increase overall.

Snapshot of participating service provider complaints for 2024–25

The CCTS tracks and reports on complaints by PSP brands. In 2024–25, the CCTS could accept complaints from customers of 427 brands operated by 305 participating service providers. It may not be obvious to consumers that different brands have common owners. For example, the four national PSP groups discussed in the above section collectively offer telecom and TV services via 71 brands.

Together, the 25 brands with the highest number of accepted complaints (referred to here as the “Top 25”) account for 96% of all accepted complaints in 2024–25.

  • Brands that participate in the CCTS: 427 operated by 305 service providers
  • New Participating Service Providers in 202425: 14 service providers
  • Share of complaints by Top 25 brands: 96% of accepted complaints
  • Share of complaints by Top 10 brands: 89% of accepted complaints
  • Three or fewer complaints: 92 service provider brands
  • Zero complaints: 255 service provider brands

Top 25 Participating Service Providers

96% of all complaints are from the top 25 service providers

Together, the Top 25 PSP brands account for 96% (21,210) of all accepted complaints in 2024–25, unchanged year over year. The remaining 4% (884) of complaints accepted were filed about 151 different service providers.

Of note, in this Annual Report, the CCTS has combined complaint data for the Rogers and Shaw brands into a single brand, referred to as “Rogers/Shaw.” All year-over-year data comparisons for Rogers/Shaw are based on combined data for both brands from the previous year. After a company is acquired, its branding can change. This can involve no rebranding (two separate brands), a period of gradual integration of the acquired brand, or the full absorption of an acquired brand into the parent company.

The Rogers acquisition of Shaw officially closed in April 2023 and was the largest telecom acquisition in Canadian history. Following the closure, the Shaw brand was evolved to “Rogers Together With Shaw.” In 2024–25, services offered on Shaw’s website were Rogers-branded services, and in June 2025, the Shaw website was retired, redirecting all products, support, and services to Rogers. For clarity in this report, the CCTS will report data about Rogers and Shaw as “Rogers/Shaw.”

Top 3

The three brands with the highest volume of complaints account for 65% of all complaints accepted by the CCTS in 2024–25. Rogers/Shaw, TELUS, and Bell remain the top three service provider brands based on accepted complaint volume. Rogers/Shaw was the brand with the highest portion of complaints, followed by TELUS and Bell. Notably, TELUS experienced a significant 78% increase in complaints, while Rogers/Shaw and Bell saw increases on par with the 17% increase in complaints across all providers.

Top 10

The 10 brands with the highest volume of complaints account for 89% of all accepted complaints this year. All the service providers in last year’s top 10 stayed on the list, except for Chatr, which moved into the top 10 after a significant 226% increase in complaints.

Fido, Virgin Plus, Videotron (for the second year in a row), and Public Mobile had fewer complaints year over year.

Top 25

The 25 brands with the highest number of accepted complaints together account for 96% of all accepted complaints. A few brands (Fongo Home Phone, EBOX, and VMedia) entered the Top 25 list this year as a result of significant year-over-year increases in accepted complaints. Below is an overview of the 25 brands with the highest number of accepted complaints. The data reflects individual brands, not their ownership groups.

Table 9.2: Top 25 PSP brands by complaints accepted

NOTE: In charts throughout this report, year-over-year increases are shown in red, and year-over-year decreases are shown in green.

* The number of concluded complaints may be higher or lower than the number of accepted complaints in a given year. This occurs because complaints accepted in one reporting year may be concluded in the following year.
† The resolution rate is the percentage of all resolved complaints vs. all concluded complaints (86.1% overall).
‡ The escalation rate is the percentage of all complaints that move to later stages of the CCTS’ process vs. all concluded complaints (21.5% overall).

NOTE: Where a complaint remains unresolved after the Initial Referral period, the complaint escalates to Conciliation or Investigation.

Figure 9.3: Top 10 PSP brands by complaints accepted


Figure 9.4: Top 10 PSP brands by resolution rate

The resolution rate is the percentage of all resolved complaints vs. all concluded complaints (86.1% overall).

Rogers/Shaw

Wireless Internet Phone TV

Insights

  • This year, the CCTS combined Rogers and Shaw brand data into a single brand called Rogers/Shaw, reflecting the integrated branding of “Rogers together with Shaw.” All year-over-year data comparisons for Rogers/Shaw are based on combined data for both brands from the previous year.
  • This year, we accepted 17% more complaints about Rogers/Shaw, consistent with the overall increase in complaints across all providers. This marks the third consecutive year of rising complaint volumes for Rogers/Shaw. This year, Rogers/Shaw accounts for 27% of all accepted complaints, down from 28% last year.
  • Rogers/Shaw customers raised the following issues more often this year:
    • Regular price increase of monthly price plan: 76% increase
    • Changes to the contract: 69% increase
    • Breach of contract: 116% increase
    • Early termination fees: 24% increase
    • Issues with rental equipment charges: from 19 issues last year to 519 issues this year, now accounting for 4% of all Rogers/Shaw issues, up from 0.2% last year. Most of these issues were due to customers raising concerns that their TV contractual arrangement provided price certainty and that the price increases to set-top-box equipment fees were not permitted.
    • Top-up issues: 2% of all Rogers/Shaw issues, up from 0% last year. The increase in top-up issues was about the loss of unused top-ups due to the retirement of Rogers/Shaw’s prepaid wireless services, and migration of these customers’ prepaid services to the Chatr brand, which is owned by the Rogers group. These issues are unique to prepaid wireless plans.
  • Television: This year, we observed a 47% increase in Rogers/Shaw TV service issues. This increase contributed significantly to overall industry increases to TV billing issues such as rental equipment fee, and increases to TV contract dispute issues such as breach of contract and change of contract. This was largely due to Rogers/Shaw increasing customer TV set-top-box rental fees. In total, the CCTS accepted 721 complaints from Rogers/Shaw customers about increases to their TV set-top-box rental fees. Customers raised concerns that their contractual arrangement provided price certainty and that the price increases to set-top-box equipment fees were not permitted. Nearly all complaints were resolved to the mutual satisfaction of the provider and the customer.

Statistics

6,485 accepted complaints
+16.6% change in accepted complaints 27.4% of all accepted complaints
5,127 resolved complaints
4,494 resolved at initial referral 633 resolved at conciliation or investigation 87.9% resolution rate
(Global: 86.1%)
Top 3 issues across all service types
13% incorrect charge for monthly price plan 11% disclosure issues 8% changes to the contract
20 Code breaches
6 Wireless Code breaches 14 Internet Code breaches 0 TVSP Code breaches 0 D&D Code breaches

TELUS

Wireless Internet Phone TV

Insights

  • This year, we accepted 78% more complaints about TELUS Communications Inc. (TELUS) than last year. This is a significant increase compared to the 17% increase across all service providers. This marks the fifth year in a row that TELUS saw an increase in CCTS complaint volumes.
  • TELUS accounts for 21% of all complaints, up from 14% last year. This is the fourth year in a row that TELUS’ share of complaints has increased.
  • TELUS customers raised the following issues more often than last year:
    • Incorrect charge for monthly price plan: the top issue raised by TELUS customers, with a 70% increase
    • Disclosure issues: 42% increase
    • Credit or refund not received: 74% increase
    • Regular price increase of monthly price plan: 195% increase
    • Breach of contract: 299% increase
  • Wireless: Wireless issues represent 49% of all TELUS issues, up 2% from last year. TELUS customers raised 84% more wireless issues than last year. The increase in wireless issues across all service providers was 9%.
  • Internet: Internet issues for TELUS increased by 71% this year, compared to a 7% increase in internet issues across all service providers. Internet issues account for 29% of all TELUS issues.
  • Television: TV issues account for 13% of all TELUS issues. TELUS TV customers raised 97% more issues than last year, compared to a 44% increase in TV issues across all service providers.
  • Code breaches: TELUS had 30 CRTC code breaches this year: twice as many as last year. See the Reporting on CRTC consumer protection codes of conduct section of the Annual Report for more details.

Statistics

4,904 accepted complaints
+77.9% change in accepted complaints 20.7% of all accepted complaints
4,036 resolved complaints
3,613 resolved at initial referral 423 resolved at conciliation or investigation 90.3% resolution rate
(Global: 86.1%)
Top 3 issues across all service types
18% incorrect charge for monthly price plan 12% disclosure issues 9% credit or refund not received
30 Code breaches
25 Wireless Code breaches 5 Internet Code breaches 0 TVSP Code breaches 0 D&D Code breaches

Bell Canada

Wireless Internet Phone TV

Insights

  • We accepted 16% more complaints about Bell Canada (Bell) this year, marking the third consecutive year of growth in accepted complaints.
  • Bell accounts for 17% of all accepted complaints, down slightly by 0.2% year over year.
  • Bell’s customers raised the following issues more often than last year:
    • Breach of contract issues: 136% increase
    • Credit or refund not received: 29% increase
  • Wireless: Bell customers raised 11% more wireless issues than last year. Wireless issues account for almost half (45%) of all issues raised by Bell customers.
  • Internet: Bell customers raised issues about internet services 19% more this year. This increase in internet issues by Bell customers is disproportionate to the 7% year-over-year internet issue increase across all providers. Internet issues account for 29% of all Bell issues.
  • Television: TV issues increased 20% year over year for Bell, compared to a 44% increase in TV issues across all providers. TV issues account for 14% of all Bell issues.
  • Code breaches: Bell breached the CRTC codes 23 times this year. See the Reporting on CRTC consumer protection codes of conduct section of the Annual Report for more details.

Statistics

3,966 accepted complaints
+15.6% change in accepted complaints 16.8% of all accepted complaints
3,156 resolved complaints
2,455 resolved at initial referral 701 resolved at conciliation or investigation 82.6% resolution rate
(Global: 86.1%)
Top 3 issues across all service types
14% incorrect charge for monthly price plan 11% credit or refund not received 9% quality of service
23 Code breaches
19 Wireless Code breaches 2 Internet Code breaches 0 TVSP Code breaches 2 D&D Code breaches

Fido (Rogers group)

Wireless Internet

Insights

  • Complaints about Fido decreased by 8% year over year.
  • Fido accounts for 8% of all accepted complaints, down from 10% last year and 12% in 2022–23.
  • Wireless: Fido’s wireless issues decreased by 29% year over year. Wireless issues continue to account for the majority of issues raised by Fido customers (93.5%).
  • Fido wireless customers reported over 110 top-up issues, representing 6% of all of Fido’s issues this year. The increase in top-up issues was about the loss of unused top-ups due to the Fido brand’s retirement of its prepaid wireless services and migration of these customers’ prepaid services to the Chatr brand, which is owned by the Rogers group.
  • Internet: Fido customers raised fewer internet issues this year, with a 61% decrease in internet issues. Issues about internet services account for 6.5% of Fido’s total issues.
  • Code breaches: Fido had three confirmed breaches this year, up from two last year. See the Reporting on CRTC consumer protection codes of conduct section of the Annual Report for more details.

Statistics

1,877 accepted complaints
-7.5% change in accepted complaints 7.9% of all accepted complaints
1,298 resolved complaints
1,154 resolved at initial referral 144 resolved at conciliation or investigation 88.4% resolution rate
(Global: 86.1%)
Top 3 issues across all service types
15% incorrect charge for monthly price plan 14% credit or refund not received 10% disclosure issues
3 Code breaches
1 Wireless Code breach 2 Internet Code breaches


Koodo (TELUS group)

Wireless Internet

Insights

  • Koodo complaints increased by 17%, which is consistent with the overall 17% increase across all service providers. Koodo accounts for 5% of all accepted complaints, the same as last year.
  • Overall, issues raised by Koodo customers increased by 16%, while issues across all service providers increased by 12%.
  • Last year, 99% of Koodo’s issues were related to wireless services. This year, distribution shifted slightly, with wireless representing 94% of Koodo’s issues and internet services accounting for 6% of Koodo’s issues.
  • Koodo customers raised the following issues more often than last year:
    • Regular price increase of monthly price plan: 80% increase
    • Chargeable messages: 75% increase
    • Third-party credit reporting: 53% increase
    • Incorrect charge for monthly price plan: 17% increase
  • Code breaches: Koodo had four confirmed breaches of the Wireless Code this year, up from three last year. See the Reporting on CRTC consumer protection codes of conduct section of the Annual Report for more details.

Statistics

1,126 accepted complaints
+16.7% change in accepted complaints 4.8% of all accepted complaints
947 resolved complaints
840 resolved at initial referral 107 resolved at conciliation or investigation 88.4% resolution rate
(Global: 86.1%)
Top 3 issues across all service types
14% incorrect charge for monthly price plan 9% disclosure issues 8% regular price increase of monthly price plans
4 Code breaches
4 Wireless Code breaches 0 Internet Code breaches

Freedom Mobile (Videotron group)

Wireless Internet

Insights

  • Complaints accepted about Freedom Mobile increased by 6%, compared to the 17% increase across all service providers.
  • Freedom Mobile accounts for 4% of all accepted complaints, the same as last year.
  • The number of issues raised by Freedom Mobile customers increased by 12% year over year.
  • Wireless: Last year, 98% of issues raised about Freedom Mobile were related to wireless services. This year, the proportion of wireless issues dropped to 92%, as 8% of issues were related to its internet services.
  • Freedom Mobile customers raised breach of contract issues 64% more often this year.
  • Code breaches: Freedom had nine confirmed breaches this year, up from one last year. See the Reporting on CRTC consumer protection codes of conduct section of the Annual Report for more details.

Statistics

940 accepted complaints
+6.2% change in accepted complaints 4% of all accepted complaints
857 resolved complaints
804 resolved at initial referral 53 resolved at conciliation or investigation 92.3% resolution rate
(Global: 86.1%)
Top 3 issues across all service types
12% disclosure issues 11% incorrect charge for monthly price plan 10% quality of service
9 Code breaches
9 Wireless Code breaches 0 Internet Code breaches

Virgin Plus (Bell group)

Wireless Internet TV

Insights

  • Complaints about Virgin Plus decreased 2% from last year. Virgin Plus accounts for 4% of all accepted complaints, unchanged from last year’s report.
  • Wireless: Wireless issues make up 80% of all Virgin Plus issues. Overall, Virgin Plus’ total issues about its wireless services declined by 7% compared to last year.
  • Internet: Virgin Plus’ internet issues increased by 22%, compared to a 7% increase across all service providers. Internet issues account for 17% of all issues raised by Virgin Plus customers, up from 14% last year.
  • Television: Issues related to Virgin Plus’ TV services increased by 163% this year. Overall, TV issues across all brands increased by 44%. TV issues account for 3% of all Virgin Plus issues.
  • Code breaches: Virgin Plus had no CRTC code breaches this year. This declined for the second year in a row, down from five last year and 14 the year before.

Statistics

831 accepted complaints
-2.2% change in accepted complaints 3.5% of all accepted complaints
704 resolved complaints
537 resolved at initial referral 167 resolved at conciliation or investigation 84.2% resolution rate
(Global: 86.1%)
Top 3 issues across all service types
13% incorrect charge for monthly price plan 11% disclosure issues 9% credit or refund not received
0 Code breaches
0 Wireless Code breaches 0 Internet Code breaches 0 TVSP Code breaches

Videotron

Wireless Internet Phone TV

Insights

  • While we saw a 17% increase in complaints across all service providers, complaints about Videotron decreased by 7%, after a 14% decrease the year before. Complaints about Videotron account for 2% of all accepted complaints, consistent with last year’s report.
  • Issues raised in complaints about Videotron services decreased by 6%, while issues across all service providers increased by 12%.
  • Internet: Internet services account for 36% of Videotron’s issues. Videotron customers reported internet issues 12% less often than last year. The number of internet issues increased 7% across all service providers.
  • Wireless: Wireless services account for 33% of all issues raised by Videotron customers. Videotron’s wireless issues increased by 9%.
  • Television: This year, we saw a 44% increase in TV issues across all service providers. However, Videotron’s TV issues decreased by 15%. TV services account for 21% of all Videotron issues, down from 23% last year.
  • Code breaches: Videotron had no CRTC code breaches this year, down from one last year.

Statistics

394 accepted complaints
-6.6% change in accepted complaints 1.7% of all accepted complaints
352 resolved complaints
333 resolved at initial referral 19 resolved at conciliation or investigation 88.4% resolution rate
(Global: 86.1%)
Top 3 issues across all service types
14% incorrect charge for monthly price plan 13% disclosure issues 8% quality of service
0 Code breaches
0 Wireless Code breaches 0 Internet Code breaches 0 TVSP Code breaches 0 D&D Code breaches

Public Mobile (TELUS group)

Wireless

Insights

  • Last year, we reported a significant spike in complaints about Public Mobile, which was largely driven by the retirement of its legacy rewards program. This year, Public Mobile complaints decreased by 61% year over year.
  • This year, Public Mobile accounts for 1% of all accepted complaints, down from 4% last year.
  • Public Mobile customers raised the following issues more often than last year:
    • Incorrect charge for monthly price plan: 47% increase
    • Changes to the contract: 7% increase
    • Intermittent quality of service: 17% increase
  • Wireless: Public Mobile’s wireless customers raised 6.5% more issues than last year, compared to an increase of 9% for wireless issues across all service providers.
  • Code breaches: Public Mobile had no CRTC code breaches this year.

Statistics

312 accepted complaints
-60.7% change in accepted complaints 1.3% of all accepted complaints
325 resolved complaints
258 resolved at initial referral 67 resolved at conciliation or investigation 58.2% resolution rate
(Global: 86.1%)
Top 3 issues across all service types
27% changes to the contract 25% credit or refund not received 11% quality of service
0 Code breaches
0 Wireless Code breaches

Chatr (Rogers group)

Wireless

Insights

  • Though they represent a small share of all CCTS complaints, complaints about Chatr increased significantly from 86 accepted complaints last year to 280 this year. Chatr accounts for 1.2% of all accepted complaints, up from 0.4% last year.
  • Wireless: There were 357 issues raised about wireless services, up from 126 last year.
  • Service delivery issues made up more than half (56%) of Chatr issues and increased significantly this year.
  • Code breaches: Chatr had no CRTC code breaches this year.

Statistics

280 accepted complaints
+225.6% change in accepted complaints 1.2% of all accepted complaints
198 resolved complaints
161 resolved at initial referral 37 resolved at conciliation or investigation 83.2% resolution rate
(Global: 86.1%)
Top 3 issues across all service types
16% quality of service 11% complete loss of service issues 7% unable to port
0 Code breaches
0 Wireless Code breaches

Monitoring service provider compliance

The Canadian Radio-television and Telecommunications Commission (CRTC) requires all providers of retail telecom services and licensed TV service providers in Canada to participate in the CCTS. This requirement ensures that all consumers in Canada can benefit from our free and effective services no matter which service provider they choose to do business with.

We regularly update information about service provider non-compliance on a dedicated webpage. To help consumers make informed choices when choosing service providers, we publish the names of providers that have been referred to the CRTC for failure to join the CCTS when required or that were expelled for not complying with their obligations.  When a service provider is expelled, we refer the matter to the CRTC for enforcement action, who can require the provider to remedy its non-compliance and rejoin the CCTS.

We also publish annual compliance reports: in June 2025, we published the 2024 Compliance Report Cards. These identify service providers and their compliance with CCTS participation requirements.

There are two categories of service provider requirements:

  • CCTS requirements that a service provider agrees to when it becomes a Participating Service Provider (PSP)

Compliance with the requirement to join the CCTS

At the end of the 2024-25 fiscal year, we had 305 providers operating 427 brands. Some providers, mainly smaller ones and those that are new to the industry, have not yet joined. Any service provider not yet enrolled must join when one of their customers files a complaint with us. Sometimes service providers choose to sign up with us on their own.

We do everything in our power to help service providers join the CCTS, and we are generally successful. Between August 1, 2024, and July 31, 2025, we enrolled 14 new service providers. This took an average of 55 days from when we contacted them to when they enrolled.

Some providers refuse to join. If we cannot persuade them to follow this CRTC requirement, we refer the matter to the CRTC for further action. In 2024–25, we referred one provider, YEGTEL Communications Inc., to the CRTC for failure to join the CCTS.

Compliance with Participating Service Provider requirements

After a provider has become a PSP, it must follow the requirements outlined in the CCTS Participation Agreement.

These are some things they must do:

  • Comply with the CCTS Procedural Code, including implementing all remedies that the CCTS awards to customers. This Code contains the rules for the CCTS’ complaint-handling process.
  • Carry out their obligations under the CCTS Public Awareness Plan, including informing customers about their right of recourse with the CCTS.
  • Pay fees and disclose certain financial information to the CCTS.

We regularly monitor PSP compliance with these requirements and work with PSPs to bring them into compliance. If a PSP continues to be non-compliant, we have a range of enforcement tools, including expelling service providers from the CCTS for non-compliance. This triggers a referral to the CRTC for further action.

There were no terminations in 2024–25 because of non-compliance.

To ensure that the CCTS complaint-handling process is efficient and effective, we monitor service provider compliance with our process and make sure customers receive the remedies to which they are entitled. When a PSP does not comply with our process, we step in.

Instances of service provider non-compliance

This year, we found 33 cases of major non-compliance by service providers in our complaint-handling process:

❌ 21 cases: the PSP failed to implement the mutually agreed resolution
❌ 11 cases: the PSP failed to implement the Investigation Findings
❌ 1 case: the PSP threatened the customer after the customer submitted a complaint to the CCTS

This represents a significant increase in major non-compliance, doubling the 2023–24 results. After we engaged with these service providers, all 33 cases of non-compliance were resolved. The customers confirmed and the PSP demonstrated to the CCTS that the agreed remedies had been carried out.

PSPs that failed to implement the mutually agreed resolution:

  • Rogers/Shaw (7)
  • Bell Canada (6)
  • Fido (2)
  • TELUS (2)
  • Bell Aliant
  • Lucky Mobile
  • TekSavvy
  • Tiny Mobile

PSPs that failed to implement the CCTS’ Investigation Findings:

  • TELUS (3)
  • NFTC (2)
  • Rogers/Shaw (2)
  • Digicom
  • Fonus
  • Start.ca
  • Tiny Mobile

Bell Canada advised a customer that it would remove previously applied credits from the account after a customer submitted a new CCTS complaint. We informed the PSP that this was not allowed.

Working with customers

Annual Report

August 1, 2024 – July 31, 2025

The CCTS values customer feedback. It helps us ensure that our complaint-handling process is accessible, professional, fair, and impartial. Feedback guides how we improve and deliver our services. This section provides a snapshot of what we heard from customers over the past year.

Customer survey results

We survey customers who have used our service during the year to ask them how we’re doing. This helps us focus our efforts for improvement. For example, customer feedback helps us to assess the effectiveness of the public awareness initiatives we require Participating Service Providers (PSPs) to implement.

In 2024–25, we received more than 5,300 survey responses from customers. We are very pleased to report that customers continue to be overwhelmingly satisfied with the service they receive from CCTS staff and with the ease of filing a complaint.

Note: Percentages are rounded.

What customers said about the CCTS

We asked our customers:

Is it important to have an independent organization to deal with telecom and TV complaints that has the authority to provide customers with compensation?

Was it easy to file your complaint with the CCTS?

“I am pleased and grateful for the existence and mandate of CCTS, as they have always been helpful and impartial in resolving customers’ complaints.”

Customer who used the CCTS’ services in 2024–25

How effective was the CCTS at providing a transparent process, including clear and transparent reasons for and decision-making regarding your complaint?

Feedback on whether the service you received from CCTS representatives met your expectations.

Feedback on whether the service you received from our complaint resolution officers met your expectations.

“I would not have any positive results from [my provider] unless I went through CCTS. I felt relief with your help. Until I went with you, I received no communication or response from [my provider]. I am grateful for your agency!”

Customer who used the CCTS’ services in 2024–25

Feedback on overall satisfaction with various aspects of our process.

Timelines: Did we complete our work in a reasonable amount of time?

Professionalism: Were we professional, knowledgeable and courteous?

Impartiality: Did we act without favouritism to either you or your service provider?

“I am very thankful for your help. It is very difficult to get to the appropriate level of authority to resolve issues with Canadian telecommunications companies without some help.”

Customer who used the CCTS’ services in 2024–25

What customers said about service provider public awareness activities

How did you find out about the CCTS?

Service providers must notify customers about the CCTS at a specified point during their internal complaint-handling process. We asked our customers:

Did your service provider tell you about the CCTS during your efforts to resolve the problem?

Service providers are required to print a prescribed message about the CCTS on customer bills four times a year. We asked our customers:

In the last year, did you see a notice about the CCTS on a bill you received from your service provider?

Service providers are required to place a prescribed notice about the CCTS in a clear, easy-to-find spot on their website and include a link to the CCTS website. We asked our customers:

Did you see a dedicated complaint section on your service provider’s website giving you information about the CCTS?

We require PSPs to inform their customers about the CCTS. Each year, the CCTS audits selected PSP websites and documents to assess compliance. When we identify non-compliance, we engage with those providers to educate them and rectify non-compliance with our provider obligations to promote awareness of the CCTS.

Read more about our public awareness compliance work in our 2024 Compliance Report Cards.

What customers said about their attempts to resolve complaints with service providers

We asked customers about their interactions with service providers before the CCTS became involved.


How long did you try to resolve your problem directly with your service provider before bringing your complaint to the CCTS?

More than 40% of respondents said they tried for more than two months to resolve their problem directly with their service provider before turning to the CCTS for help.


How many levels of escalation (front line customer service, supervisor, manager, etc.) did your complaint go through with the service provider before you filed a complaint with the CCTS?

Over 80% of customers experienced two or more levels of escalation before filing a complaint.

Public awareness of the CCTS

Raising public awareness of the CCTS is important work. We remain committed to increasing the profile of our service so that consumers across Canada are better informed about their right to recourse and how the CCTS can help when needed.

This past year, the CCTS used a market and data-driven approach to sustain, refine, and scale up public awareness tactics that we began implementing in 2023–24.

We are happy to share that we continue to observe strong progress in our public awareness efforts, including a 13% year-over-year increase in CCTS website traffic. Customer survey data showed a significant increase in the proportion of customers who discovered the CCTS via social media.

From media and online engagement to stakeholder collaboration and more, we have been hard at work.

  • Media coverage: We added new distribution methods to extend our media reach and distribute information to relevant audiences. These efforts delivered a three-fold increase in potential reach compared to 2023–24 and a substantial improvement in the number of news sources that published our content. We noted coverage in small community publications and outlets reporting in languages other than English and French, giving the CCTS more exposure in diverse markets across Canada.
  • Podcasts: We promoted the CCTS in a pilot experiment through podcast and music streaming platform advertising to reach more telecom and TV consumers. Podcasts provide a high degree of listener trust and can help build brand awareness in a non-intrusive way among engaged niche audiences.
  • Promotional content: Consumer-focused content about the CCTS potentially reached around 45 million people across Canada through print and digital articles, short videos, and radio ads.
  • Partnerships: We worked with our valued partners to explore collaboration opportunities and reach a wider audience across Canada. In April, we participated in our first public webinar with Option consommateurs, a non-profit that defends consumer interests, as part of their series for seniors. This gave our team a valuable opportunity to connect effectively with an audience that can benefit from knowing about our service and their right to recourse. Through this partnership, we were able to inform audiences during the webinar, which had nearly 300 registrants and the post-event recordings. We reached many more through the Option consommateurs website and social media channels.
  • Vulnerable consumers: This past year, we expanded our activities to inform harder-to-reach consumers who may have challenges navigating the marketplace. We began audience mapping to guide our strategic communications plan to connect with specific consumer segments across Canada.

Dealing with unresolved phone, TV or internet issues? We can help, for FREE.

Gaining insights about customer experiences

Our Consumer Advisory Panel helps us understand the diverse needs and challenges of telecom and TV consumers across the country. The panel brings together several groups representing a diversity of vulnerable, hard-to-reach consumers and consumers from geographically diverse regions across Canada. We met with the panel twice in 2024-25, during which we had the opportunity to engage with nine groups.

Meeting with the panel serves four key purposes:

  • Gain a deeper understanding of the needs of vulnerable, disadvantaged, and hard-to-reach consumers.
  • Collect insights on key issues within the telecom and TV sector that may impact complaints and complaint volumes.
  • Help consumer groups understand our mandate, operations, and reporting more clearly.
  • Collaborate with and expand our outreach efforts to consumers across the country.

During this year’s sessions, we heard about several top-of-mind issues that affect customers’ experiences with their telecom and TV service providers:

  • We heard that consumers are navigating a sustained trend of billing-related complaints, including price increases and contract disputes. This has been a prominent issue over the last few years and reflects broader financial pressures that households face.
  • We discovered useful insights about topics where we could provide more guidance and clarity for consumers. For example, groups suggested that we incorporate additional consumer scenarios into our reports and our public awareness work to enhance a tangible understanding of our work and increase public engagement.
  • Consumer groups expressed concerns about service providers not informing customers about their right to the CCTS’ services. They underscored the importance of service providers taking part in public awareness efforts. In November 2024, the Canadian Radio-television and Telecommunications Commission (CRTC) reminded providers about their responsibility to inform customers about the CCTS and stated its view that Canadians are not being made aware of the CCTS effectively. The CRTC requested information from the industry to determine whether further regulatory action is necessary. In October 2025, the CRTC launched a new proceeding to help ensure that Canadians with unresolved complaints get timely and clear information from their service provider about the CCTS.

Consumer groups signalled continued support for our public awareness efforts and emphasized the importance of trust-building and community engagement for effective outreach within specific communities.

“I believe CCTS is the best thing ever a country can have for their citizens… thanks a lot for helping me out.”

Customer who used the CCTS’ services in 2024–25

Our commitment to accessibility

Providing accessible customer service so people with disabilities can contact us easily and use our services is a core value and a key operating principle in our strategic plan. Our commitment is deeply rooted and reflects the principles of the Accessible Canada Act and the Accessibility for Ontarians with Disabilities Act (our head office is in Ontario). These two Acts guide us in upholding values of independence, dignity, integration, and equality of opportunity.

We consult with accessibility groups and underrepresented and underserved communities every year. This helps us to understand how we can better serve all telecom and TV customers in Canada. In 2024–25, we convened a forum with representatives from six accessibility groups:

  • We shared how we have improved our website after doing accessibility scans and user testing.
  • The participating groups emphasized that to reach specific audiences effectively, campaign design needs to prioritize accessibility during the early development stages. Building for accessibility ensures that content is inclusive and engaging for diverse audiences — including those with visual, auditory, cognitive, or language-related needs.
  • We discussed how co-designing communication outputs with people who have lived experience is essential for effective and inclusive program development.
  • Participants offered to work with us to promote awareness of who we are and what we can do for customers.

Customers can reach the CCTS through accessible telephone and e-services, such as:

  • TTY (teletypewriter)
  • VRS (Video Relay Service)

We offer to communicate in the most accessible way to customers upon request. Visit our website to learn more about our updated Multi Year Accessibility Plan and Integrated Accessibility Policy.

We look forward to continuing our conversations with consumer advocacy and accessibility groups, as they play a vital role in deepening our understanding of the customer experience and the specific needs of vulnerable consumers.

“Very helpful! I truly believe my issue would not have been resolved without the CCTS. My only concern is how many people out there do not know about the CCTS. Thank you for all your help!”

Customer who used the CCTS’ services in 2024–25

Other statistical highlights

Annual Report

August 1, 2024 – July 31, 2025

Contact Centre activities

Our Contact Centre received more than 124,000 communications by telephone, in writing, and by online chat in 2024–25. This is a marginal increase of 0.2% from last year.

Table 11.1: Communications received
Type of communication 2024-25 Year-over-year change
Written correspondence* 67,235 +16%
Phone calls answered 54,075 -14%
Chat sessions answered 2,922 +2%
Total communications 124,232 +0.2%

* Written correspondence refers to communication received via email, postal mail, and the CCTS online complaint form.

Written correspondence increased for the second year in a row. This year we saw a 16% increase after an increase of 76% last year. For the first time, it became the most-used type of communication, replacing phone calls.

Out-of-mandate issues

Each year, some customer complaints raise issues that we are unable to accept because they fall outside our mandate. The Canadian Radio-television and Telecommunications Commission (CRTC) set our mandate and reviews it from time to time.

The scope of complaints that the CCTS is authorized to receive, along with examples of services and subjects that fall outside the scope of the CCTS, are set out in our Procedural Code. When we receive complaints that are outside our mandate, such as pricing, infrastructure, or privacy issues, we notify the customer and the provider. We then refer the customer to a more appropriate organization or complaint-handling body.

The tables below show the number of issues raised by customers that we could not accept because they were outside our mandate.

Procedural Code Section 3

Out-of-mandate issues have declined for six consecutive years, with a 30% decrease this year despite an increase in accepted complaints and issues. This steady downward trend may be due to the positive impact of ongoing improvements, such as complaint handling process and online customer complaint form enhancements.

Table 11.2: Procedural Code Section 3
Issue Number
Out-of-mandate telecom issues
Internet applications and content, s. 3.1(a)(i) 44
Infrastructure
s. 3.1(c)(vi) rights of way
s. 3.1(c)(vii) plant, poles, towers
s. 3.1(c)(iv) networking services
602
Customer equipment and wiring
s. 3.1(c)(i) customer-owned equipment
s. 3.1(c)(ii) inside wiring
259
Regulated services
s. 3.1(a)(ii) emergency services
s. 3.1(a)(iii) payphones
s. 3.1.(a)(vi) 900/976 calls
26
Telemarketing and unsolicited spam, s. 3.1.(a)(v) 180
Phone or internet scams 95
Other
s. 3.1(a)(iv) Yellow Pages or business directories
38
Out-of-mandate broadcasting issues
Content
s. 3.1(b)(i) digital media broadcasting undertaking services
s. 3.1(b)(ii) interactive TVSP services and applications
s. 3.1(b)(iii) broadcasting content
s. 3.1(b)(iv) journalistic ethics
s. 3.1(b)(vi) simultaneous substitution
62
TVSP not required to participate in CCTS 10
Other 20
Other out-of-mandate issues
False/misleading advertising, s. 3.1(c)(viii)  374
Aggressive tactics 239
Privacy issues, s. 3.1(c)(ix) 420
Pricing, s. 3.1(c)(v) 590
Security services, s. 3.1(c)(iii) 305
Total for all out-of-mandate issues* 3,264

* Some out-of-mandate issues are raised in complaints that also raise in-scope issues.

Procedural Code Section 4

Complaints about customer service, operating practices, or service provider policies do not fall within our mandate. However, we track the inquiries we get about these issues.

This year, we saw the fourth year in a row of decreases. There were 4,337 issues, representing a 15% decrease year-over-year.

Table 11.3: Procedural Code Section 4
Issue Number
Section 4.1 Customer service
Rude representative 327
Wait times 472
Other – Customer services 1,161
Total 1,960
Section 4.3 General operating practices and policies 2,377
Total issues 4,337

Procedural Code Section 10

Under our Procedural Code, we have a duty to decline complaints when:

  • The customer has not yet given the service provider a reasonable opportunity to resolve the issues (Section 10.1).
  • The same complaint had been or was being dealt with by another agency with authority to compensate the customer for loss (Section 10.2(b)).
  • The facts of the complaint relate to events that happened more than a year before the complaint was submitted (Section 10.3(a)).
  • The complaint is about issues that happened more than one year before the service provider joined the CCTS as a Participating Service Provider on or after September 1, 2017 (Section 10.3(b)).

While we must decline such complaints, we track and report on them.

In the past year, issues that fell under our duty to decline to take action increased by 35%, following a decrease of 83% last year. At the end of the fiscal year (July 2025), we added guidance to our complaint form to help customers understand that they must work with their service provider before submitting a complaint to the CCTS.

Table 11.4: Procedural Code Section 10
Issue Number
Section 10.1 PSP not offered the opportunity to resolve 226
Section 10.2(b) matter previously or currently with another agency 33
Section 10.3(a) facts transpired over one year ago 437
Section 10.3(b) facts arose one year prior to PSP joining the CCTS 2
Total issues 698

Out-of-mandate accessibility issues

Most issues about a service provider’s failure to accommodate a customer’s accessibility requests are outside of our mandate.

At the request of the CRTC and members of the accessibility community, we track when customers raise out-of-mandate accessibility issues about their service providers. We also refer these issues to the CRTC, which may have the authority to address them.

Table 11.5: Out-of-mandate accessibility issues

Issue Number
Customer Service – indifferent to customer’s disability 141
Accessibility-related accommodation issue (e.g. video relay services (VRS), message relay services (MRS), closed captioning, or described video not available; accessible handset not offered; store accessibility issues; refused to provide accessibility plan) 79
Policies and procedures (e.g. do not include accessibility information, or accessibility policy or practice not honoured) 104
Total out-of-mandate issues 324

The CRTC codes that we administer contain some accessibility-related requirements. These are within our mandate. The Wireless Code, Television Service Provider Code, and Internet Code require two kinds of accommodations:

  • an extended trial period for individuals with disabilities
  • contracts and related documents provided in an accessible format upon request

For more information, see Code of Conduct Reporting.

Analysis of closed complaints

This year, we closed 2,059 complaints. Most of these were due to uncooperative customers (59%), withdrawn complaints (19%), and duplicate complaints (15%). The following table breaks down the reasons for closing complaints and refers to the relevant sections of the Procedural Code.

Table 11.6: Complaints closed by reason for closure
Complaint Issues % of all closed complaints
Closed as duplicate 315 15.3%
Customer withdrew complaint 395 19.2%
Out-of-mandate after further information obtained 22 1.1%
Section 9.1(b) Customer is not authorized to file complaint 11 0.5%
Section 9.1(c) Complaint more appropriately handled by another agency 50 2.4%
Section 9.1(d) Further investigation not warranted 0 0.0%
Section 9.1(e) Customer not cooperative 1,215 59.0%
Section 10.1 Service provider not offered opportunity to resolve 5 0.2%
Section 10.2(b) Matter previously or currently with another agency 5 0.2%
Section 10.3(a) Complaint filed outside time limits 41 2.0%
Section 10.3(b) Facts arose one year prior to PSP joining the CCTS 0 0.0%
Total complaints 2,059 100%

We close complaints under section 9.1(e) of our Procedural Code when a customer does not cooperate with our efforts to process and investigate their complaints. For example, we may close a complaint if the customer does not provide information about their complaint, does not respond to our inquiries, or refuses to engage with their provider during the 20-day Initial Referral stage. We make multiple attempts to elicit customer cooperation before closing a complaint.

Small business customer complaints

Our mandate provides recourse for small business customers whose monthly bill for all telecommunications services is normally under $2,500.

For the second year in a row, we saw an increase in complaints from small business customers. In 2024–25, we concluded 2,136 complaints submitted by small business customers, an increase of 60% from the previous year. This represents 10% of all concluded complaints this year.

The were 4,326 issues reported within those 2,136 complaints. This is a 52% increase in issues from last year. Small business customer issues make up 10% of all issues, up from 7% last year.

When we report our operational statistics, we include the data for all the complaints we dealt with during the year. However, not all complaints are the same. Complaints from small business customers are often very different from those of individual consumers. The following tables highlight the differences.

Table 11.7: Small business complaint subjects vs. consumer complaint subjects
Issue category Small business customers Individual customers
Billing 43.3% 46.6%
Contract dispute 31.6% 24.3%
Service delivery 21.5% 25.0%
Credit management 3.4% 3.9%
In-mandate accessibility issues 0.1% 0.2%
Table 11.8: Small business complaint service types vs. consumer complaint service types
Service type Small business customers Individual customers
Wireless 59.7% 49.7%
Internet 23.6% 27.8%
Local phone 16.3% 6.6%
Long distance 0.3% 0.2%


  • Wireless issues remain the most raised by small business customers and are raised more frequently when compared to individual customers: 60% of issues raised by small business customers are about wireless services, up from 42% last year.
  • The proportion of small business internet issues decreased for the second year in a row and now accounts for 24% of small business issues, down from 33% last year.
  • Billing issues remain the most-raised issue, accounting for 43% of issues raised by small business customers, up from 38% last year.
Table 11.9: Top 10 small business complaint issues
Issue Small business customers Individual customers
Incorrect charge for monthly price plan 15.3% 13.7%
Disclosure issues 12.7% 9.6%
Credit or refund not received 8.8% 9.2%
Breach of contract 6.5% 5.3%
Regular price increase of monthly price plans 6.3% 6.8%
Termination fee 6.1% 3.1%
Quality of service 5.8% 8.4%
Changes to the contract 4.2% 5.5%
Complete loss of service 3.2% 3.9%
Third-party credit reporting 3.2% 3.7%


Compensation analysis

When complaints are resolved through the CCTS process, customers may receive compensation from their service provider. This compensation can take many forms, including:

  • bill credits
  • bill adjustments
  • free or discounted products and services
  • cash payments

At the Conciliation and Investigation stages, the CCTS may issue Investigation Findings that require providers to remedy the situation, including compensating the customer. At the Initial Referral stage, details of resolutions are often not shared with us, although some form of compensation might be part of the resolution reached directly between the customer and provider.

Based on the limited information available to us, total compensation awarded to customers through our process in 2024–25 was $4,243,774.

Table 11.10: Number of complaints in which compensation was awarded
Compensation range Number of complaints Percentage of compensation complaints
less than $100 4,259 32.8%
$100 – $499 6,708 51.7%
$500 – $999 1,251 9.6%
$1,000 – $4,999 704 5.4%
$5,000 or more 43 0.3%
Total 12,965 100%

Performance standards

Each year, we set a goal to provide great customer service, and we track our performance across various benchmarks. The following tables show how our performance this year compares to those benchmark targets.

We are pleased to have exceeded our performance targets for the contact centre and most complaint-handling standards this past year, despite a significantly increased volume of accepted complaints last year and a continued, though smaller, increase this year. We accepted over 95% of complaints within three business days, and we concluded 85% of complaints within 60 days.

This year, we enhanced the efficiency of our Conciliation stage, resulting in major improvements. We concluded 76% of complaints at this stage within 60 days from the time they were referred to Conciliation. We continue our efforts to improve the efficiency of the Investigation stage of our process. Only about 5% of complaints are concluded at Investigation.

Contact Centre

Table 11.11: Contact Centre performance standards
Process 2024‑25 Target
Answer phone calls within 120 seconds 84.6% 80%
Process written communications within five business days 98.5% 80%

Complaint handling

Table 11.12: Complaint handling performance standards
Process 2024‑25 Target
Assess complaints to determine if they meet eligibility criteria within three business days 95.3% 80%
Complaints concluded across all stages within 60 days 85.4% 80%
Complaints concluded at Initial Referral stage within 30 days of acceptance 89.9% 80%
Proportion of complaints concluded at Initial Referral stage – 78.5%
Complaints concluded at Conciliation stage within 60 days of referral to Conciliation 76.2% 80%
Proportion of complaints concluded at Conciliation stage – 16.4%
Complaints concluded at Investigation stage within 90 days of referral to Investigation 42.2% 80%
Proportion of complaints concluded at Investigation stage – 5.0%

Regional analysis

We receive complaints from customers across Canada. Here, we identify the number of accepted complaints by province and territory.

* Population estimates, quarterly (statcan.gc.ca)

Table 11.13: Complaints accepted by province/territory
Province Complaints Population*
Alberta 2,957 12.5% 4,980,659 12.0%
British Columbia 4,858 20.5% 5,719,961 13.8%
Manitoba 685 2.9% 1,507,330 3.6%
New Brunswick 424 1.8% 859,839 2.1%
Newfoundland and Labrador 173 0.7% 545,464 1.3%
Northwest Territories 7 0.0% 45,242 0.1%
Nova Scotia 387 1.6% 1,080,418 2.6%
Nunavut 5 0.0% 41,572 0.1%
Ontario 9,964 42.1% 16,176,977 38.9%
Prince Edward Island 61 0.3% 180,029 0.4%
Quebec 3,807 16.1% 9,110,616 21.9%
Saskatchewan 259 1.1% 1,253,569 3.0%
Yukon 60 0.3% 47,111 0.1%
Total 23,647 100% 41,548,787 100%

* Canada, Statistics Canada, Table 17-10-0009-01 (formerly, CANSIM 051-0005)

Governance

Annual Report

August 1, 2024 – July 31, 2025

Board of Directors

Our Board is composed of seven directors who are elected for a three-year term:

  • Four independent directors, two of whom are appointed by Canadian consumer advocacy groups.
  • Three industry directors, one from each of the following groups:
    • Incumbent Local Exchange Carriers (ILECs)
    • cable companies
    • other Participating Service Providers (PSPs)

Independent Directors

Trish Kiley, CPA, CA, ICD.D (Board Chair, appointed October 2024)


Michel Tremblay, MBA, C.Dir.

Independent Directors: Consumer group appointees

Geneviève Saumier, B.C.L., LL.B., PhD


Catherine Middleton, MBA, PhD, ICD.D

Industry Directors: ILECs

Ruby Barber, LL.B. (Retired June 2025)


Molly Samuelson, BA, LL.B. (Effective June 2025)

Industry Directors: Cable companies

Leonard D. Eichel, BASc, MFA

Industry Directors: Other PSPs

Todd Hofley, BA, MFA

For up-to-date biographies, visit our Board of Directors page on our website.

Board changes

In June 2025, Ruby Barber, LL.B., retired from the Board as Industry Director representing the ILECs. Molly Samuelson, BA, LL.B., joined the Board to represent the ILECs.

Board attendance

Committees and working groups: Membership and meetings

The Board’s committees and working groups for 2024–25, along with their meeting dates, are listed below.


Audit Committee
Geneviève Saumier (Chair), Trish Kiley (until Oct 2024), Michel Tremblay (starting Oct 2024), Leonard D. Eichel

2024 Meetings 2025 Meetings
  • August 28
  • October 8
  • December 18
  • April 2
  • April 16
  • May 28

Corporate Governance Committee
Trish Kiley (Chair), Catherine Aczel Boivie (until Oct 2024), Catherine Middleton, Ruby Barber (until Oct 2024), Todd Hofley (starting Oct 2024)

2024 Meetings 2025 Meetings
  • September 16 (Ruby Barber absent)
  • December 19
  • March 31
  • May 29

Independent Directors Committee
Trish Kiley (Chair), Catherine Aczel Boivie (until Oct 2024), Catherine Middleton, Geneviève Saumier, Michel Tremblay (starting Oct 2024)

2024 Meetings 2025 Meetings
  • September 25
  • October 21
  • October 22
  • January 8
  • February 10
  • February 18
  • May 16
  • June 9
  • June 19
  • July 8 & 9

Budget Working Group
Catherine Middleton, Ruby Barber, Leonard D. Eichel (observer)

2024 Meetings 2025 Meetings
  • none
  • May 1 (Ruby Barber absent; Todd Hofley observed)
  • May 7
  • May 14 (Ruby Barber absent)
  • May 21
  • May 26
  • May 30
  • June 3
  • June 4

CCTS financials

Refer to Appendix C for our audited financial statements for the fiscal year 2024-25.

The CCTS is a not-for-profit corporation originally incorporated under Part II of the Canada Corporations Act. In January 2014, the CCTS was continued under the Canada Not-for-profit Corporations Act.

The CCTS is funded entirely by its Participating Service Providers (PSPs), based on a formula approved by CCTS members.

Large PSPs pay a fee based on the proportion of their revenues relative to the total revenues of all the large service providers. Small PSPs pay a nominal annual fee. All providers pay a fee for each of their customer complaints that we conclude during the fiscal year. Another source of revenue is bank interest.

The service is free for customers who file a complaint.

In the fiscal year 2024–25, the CCTS recorded a surplus of revenues over expenditures. The CCTS typically returns the surplus to the industry as a credit to PSPs against future invoices. However, in 2024-25, the CCTS Board and Members approved retaining the surplus to assist with anticipated operational costs for the upcoming year and future technological capital investments.

Appendices

Annual Report

August 1, 2024 – July 31, 2025

Appendix A – Complaints by service provider

Appendix B – Detailed analysis of issues raised in complaints

Appendix C – Financial statements

Appendix D – Issue classification system

Glossary

Annual Report

August 1, 2024 – July 31, 2025

Definitions

This section provides definitions for terms we use in this report. To find out more about our complaint process, visit Complaint resolution process explained on our website.


Accepted complaint

An accepted complaint is a complaint by a customer that falls within our mandate.
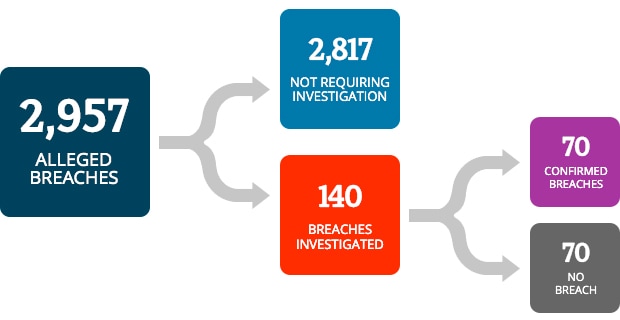
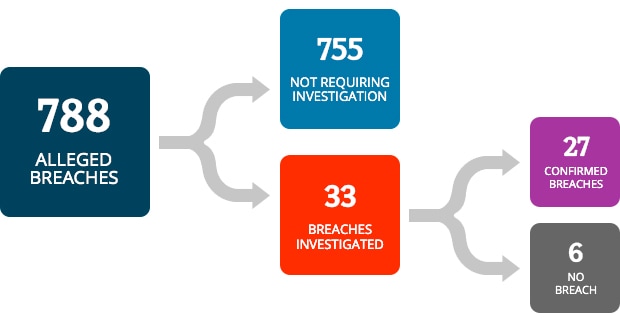
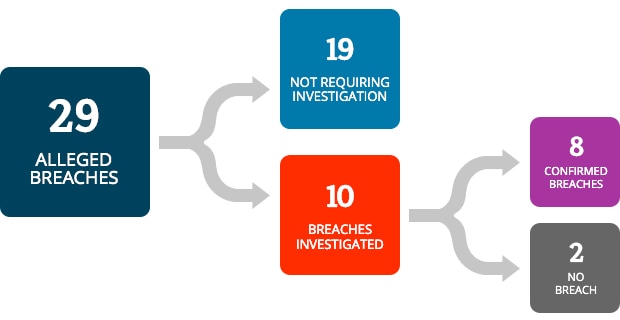

Alleged breach

An alleged breach happens when one or both of the following occur:

  • A customer reports that a service provider has breached a particular section of a CRTC code.
  • We identify a possible breach of the CRTC code when we assess the customer’s complaint.

A breach remains an alleged breach until we confirm it through investigation. There may be more than one alleged breach in a complaint. A breach happens when a service provider fails to follow the rules set out in the applicable CRTC Codes of Conduct:


Assessment

During an assessment, we review the complaint and information the customer provided to determine if we can accept the complaint.


Case Review

A customer or service provider may request a Case Review of the Investigation Findings under these two conditions:

  • They believe we made an error of fact or interpretation.
    and
  • They believe our error affected the Investigation Findings.

If it seems more likely than not that we made such an error, we conduct a Case Review. Then we issue a Case Review by confirming or amending the Investigation Findings.


Closed complaint

A closed complaint is one we have accepted but closed without resolving or investigating the issues. These are the two most common situations where we close complaints:

  • The customer withdrew their complaint.
  • The customer failed to communicate with us or cooperate with our process.

Code of conduct

We use four mandatory CRTC Codes of Conduct to assess the conduct of service providers:


Conciliation

A complaint moves to Conciliation under these two conditions:

  • It remains unresolved after Initial Referral.
  • The service provider has supplied the required information and documentation about its response to the complaint.

Conciliation is informal. We work with the customer and the service provider to explore ways to resolve the complaint without going through the time and expense of a full investigation.


Concluded complaint

A complaint is concluded when it is resolved, when we close it, or when we have issued Investigation Findings.


Confirmed breach

A confirmed breach is an alleged breach of a CRTC code that we confirmed through our investigation. A breach happens when a service provider fails to follow one of four codes of conduct issued by the CRTC:


Customer not cooperative

A customer is considered not cooperative if they fail to do one or both of the following:

  • respond to our attempts to communicate with them
  • communicate with the service provider during the Initial Referral stage of our process

If, after several attempts, we cannot get the customer to cooperate, we close the complaint.


Initial Referral

When we accept a complaint, it goes to the Initial Referral stage. At this point, we refer the complaint back to the service provider to give it another opportunity to resolve the complaint with the customer. The customer and the service provider have 20 days to resolve the issue at Initial Referral. If they don’t resolve it, it goes on to the next stage of the process.


Investigation

During the Investigation, we analyze the information the service provider and the customer supplied. We want to know if the service provider acted appropriately and whether it reasonably met its obligations to the customer as set out in its terms of service, contracts, invoices, call notes, recordings, etc.


Investigation Findings

Investigation Findings are a written report of the result of our analysis and assessment of the complaint. We issue written Investigations Findings to detail our analysis of the facts based on the information the customer and service provider gave to us. These findings explain our assessment of whether the service provider met its obligations to the customer. If they did not, the findings explain what the provider must do to fix the issue.

We have the authority to require the service provider to fix the problem by doing one or more of these actions:

  • explain or apologize for the problem
  • correct the problem, such as correct a billing error
  • reconnect a service
  • stop collections activity
  • reimburse the customer for proven financial losses to a maximum of $5,000

Issue

An issue is a specific concern a customer raises in a complaint. A complaint can contain more than one issue. For example, a customer complains that their bill contains an error and that the unpaid balance resulted in a service disconnection. This is one complaint with two separate issues.


No breach

After we investigate an alleged breach, we conclude there is no breach if we find that the service provider did not violate any CRTC code provision.


Out-of-mandate

Certain complaints fall outside our mandate. These include complaints about privacy, telemarketing calls, and advertising. Since they are out-of-mandate, we cannot accept them.


Received complaint

Received complaints are complaints that customers submit. We review complaints to determine if they are within our mandate. We accept complaints that fall within our mandate.


Resolved complaint

A complaint is resolved when both the customer and the service provider agree to the solution.