Working with Service Providers

Annual Report

August 1, 2022 – July 31, 2023

The mission of the CCTS is to provide outstanding dispute resolution service to Canadian customers and telecommunications and television service providers.

We help resolve disputes and conduct our work in keeping with our values: to be effective, rigorous, competent, unbiased, fair, responsive, and accessible.

When customers and service providers are unable to resolve their disputes, the CCTS determines whether the provider acted appropriately and reasonably in the matter. The CCTS works to identify the key drivers of customer complaints so that service providers can better understand their customers’ complaints and consider internal change to address the issues raised, and so that customers can be informed of trends in complaints.

National PSP groups complaint proportion analysis across last five years

In this section, we review the percentage of customer complaints related to major national service provider groups. These groups represent the largest telecom and TV service providers which offer wireless services nationally to consumers and internet, phone, and TV service to large regions of Canada. These providers offer services to consumers through various brands, subsidiaries, and affiliates.

  • Rogers group: Rogers Communications, Source Cable Ltd., Simply Connect, Kincardine Group, Fido, Compton Communications, Cityfone, Chatr Wireless, Cable Cable Inc., Cross Country TV, RuralWave, Seaside Communications powered by Rogers, Seaside Wireless powered by Rogers, Zoomer, Shaw, Shaw Direct, KWIC Internet
  • Bell group: Bell Canada, Bell Aliant, Bell MTS, Dryden Municipal Telephone System (DMTS), Kenora Municipal Telephone System (KMTS), Lucky Mobile, PC Mobile (pre-paid), Solo Mobile, Virgin Plus, Bell Mobility, Vox, Bell Satellite TV, Axia FibreNet, Distributel, Acanac, Navigata, EBOX, Primus, Télébec, Cablevision du Nord de Québec, Groupe Maskatel Québec S.E.C., NorthernTel, Ontera, Northwestel
  • TELUS group: TELUS Communications Inc., Koodo, Mascon Communications Inc, PC Mobile (post-paid), Public Mobile, TELUS Satellite, Mascon Cable, ABC Communications, Omega Cable, Start.ca, Altima Telecom, GTA Telecom Inc., GoCo.
Figure 8.1: Accepted complaints trend over three national PSP groups
Figure 8.2: Proportion of accepted complaints for the three national PSP groups

There was a significant amount of industry consolidation this year, as all three national PSP groups acquired various telecommunications and television providers. Most notably, Rogers completed its acquisition of Shaw. Of note for the other two PSP groups, Bell acquired smaller providers such as Distributel, Acanac, Primus, and EBOX, while TELUS acquired providers like Start.ca and Altima Telecom.

  • The Rogers, Bell, and TELUS groups showed an upward trend in complaint numbers this year.
  • The three national PSP groups accounted for 81% of all accepted complaints this year, up 9% (from 72%) last year.
  • Among the three national PSP groups, the Rogers group experienced the most significant increase in the proportion of total complaints over the last five years. This year marked the largest year-over-year increase. Its proportion of accepted complaints increased by 9%, from 27% last year to 36% this year.
  • The Bell group accounted for 25% of all accepted complaints across all service providers, down 3% from the previous year. This continues a downward trend in their portion of accepted complaints over the last five years. Since 2018, the number of accepted complaints about the Bell group has decreased by over 51%, from 7,646 reported in 2018-19 to 3,658 this year.
  • This year, the TELUS group accounted for 20% of all accepted complaints across all service providers, up from 17% last year.

Top 25 Participating Service Providers

Table 8.1: Top 25 PSPs by complaints accepted

* The number of concluded complaints can be higher than the number of accepted complaints because some complaints accepted in 2021-22 were concluded in 2022-23.
† The resolution rate is the percentage of all resolved complaints vs. all concluded complaints (89% overall).
‡ The escalation rate is the percentage of all escalated complaints vs. all concluded complaints (16.9% overall).

NOTE: Where a complaint remains unresolved after the pre-investigation or initial referral period, the complaint escalates to conciliation or investigation.


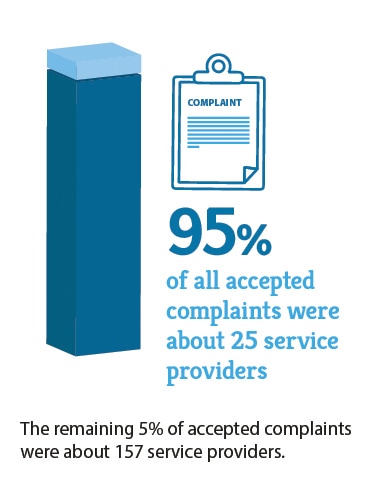
Together, the top 25 PSPs accounted for 95% of all accepted complaints in 2022-23. The remaining 5% of accepted complaints, 753 complaints, are about 157 service providers.

Top 3: For the first time in our annual reporting, Rogers emerged as the service provider with the highest number of complaints, followed by Bell and TELUS.

Top 10: Overall, the majority of the service providers in the Top 10 list stayed in the list, with the exception of Xplore which was replaced by Fizz.

Top 25: There are a few changes to the list of service providers that fall into the Top 25 PSP list this year. Notably, the following service providers experienced a significant increase in accepted complaints, compared to the 14% increase in overall complaints:

  • Rogers (44% increase),
  • TELUS (43% increase),
  • Eastlink (132% increase),
  • Phonebox (129% increase),
  • Starlink (229% increase), and
  • EBOX (153% increase).
  • Phonebox, Starlink, and EBOX enter the Top 25 list for the first time.
  • Bell MTS and Xplore experienced a significant drop in accepted complaints, seeing year-over-year declines of 52% and 42% respectively.
Figure 8.3: Top 10 PSPs by complaints accepted


Figure 8.4: Top 10 PSPs by resolution rate

The resolution rate is the percentage of all resolved complaints vs. all concluded complaints (89% overall).

Rogers

Wireless Internet Phone TV

Highlights

  • Complaints about Rogers increased by 44% compared to a 14% increase in complaints for all service providers this year. It is a notable increase and makes Rogers the most complained about service provider in 2022-23.
  • Rogers accounts for 20% of all accepted complaints. Over the past four years, Rogers has shown an upward trend in its proportion of accepted complaints, going from 11% to 20%.
  • Rogers’ wireless issues increased by 35% compared to last year, a significant increase considering a 6% increase in wireless issues across all service providers. Wireless issues account for 45% of all Rogers’ issues.
  • Rogers’ customers raised internet issues 32% more often than last year. Internet issues account for 31% of all Rogers’ issues.
  • Issues with Rogers’ TV services increased by 35% this year. By comparison, TV issues decreased by 12.5% across all service providers.
  • Service delivery issues for all of Rogers’ service types increased by 49% this year. This is a significant increase compared to a 10% increase in service delivery issues across all service providers. A major contributor to Rogers’ service delivery issues was a significant increase (138%) in complete loss of service Rogers accounts for the highest proportion of complete loss of service issues at 29%, up 11% from last year.
  • Rogers’ customers raised the following issues more often than last year:
    • Complete loss of service — 138% increase
    • Incorrect charge — 34% increase
    • Credit or refund not received — 66% increase
    • Quality of service — 26% increase
  • Rogers had two confirmed breaches of the Wireless Code, a decrease from seven breaches last year and 25 breaches in 2020-21. Both breaches were about disconnection issues, in which Rogers failed to include all relevant information and provide the required notice to the customer before disconnection.
  • Rogers also had two confirmed breaches of the Internet Code this year about disconnection issues.

Statistics

2,893 accepted complaints
43.6% change in accepted complaints 19.8% of all accepted complaints
2,435 resolved complaints
2,092 resolved at pre-investigation or initial referral 343 resolved at conciliation or investigation 89.7% resolution rate
(Global – 89%)
Top 3 issues across all service types
15% disclosure issues 14% incorrect charge for monthly price plan 12% quality of service
4 Code breaches
2 Wireless Code breaches 2 Internet Code breaches 0 TVSP Code breaches 0 D&D Code breaches

Bell

Wireless Internet Phone TV

Highlights

  • Complaints about Bell increased by 7% this year. By comparison, the CCTS saw a 14% increase in complaints across all service providers.
  • Bell accounts for 16% of all accepted complaints, down from 17% last year and 21% the year before.
  • Bell’s wireless issues decreased by 19%, a significant decrease compared to the 7% increase of wireless issues across all service providers. Bell’s wireless issues account for 44% of their overall issues, which is lower than the overall proportion of wireless issues across all service providers, 55%.
  • Bell’s internet issues decreased by 13% this year. Internet issues account for 29% of all Bell issues, up from 27% last year.
  • TV issues account for 12% of all Bell issues, down from 14% last year. Bell’s TV issues decreased 30% this year, which represents the largest decrease in Bell’s issues this year.
  • Disclosure issues were Bell’s most-raised issue this year, accounting for 14% of the service provider’s issues. Issues related to incorrect charge of the monthly price plan dropped to second place, accounting for 13% of Bell’s overall issues.
  • Bell had five confirmed Wireless Code breaches this year. These breaches account for 10% of all confirmed breaches under the Wireless Code. Three confirmed breaches were about unlocking issues, and the other two confirmed breaches were about key terms in the contract and failure to use plain language.

Statistics

2,355 accepted complaints
7.1% change in accepted complaints 16.1% of all accepted complaints
1,746 resolved complaints
1,361 resolved at pre-investigation or initial referral 385 resolved at conciliation or investigation 84.4% resolution rate
(global – 89%)
Top 3 issues across all service types
14% disclosure issues 13% incorrect charge for monthly price plan 12% quality of service
5 Code breaches
5 Wireless Code breaches 0 Internet Code breaches 0 TVSP Code breaches 0 D&D Code breaches

TELUS

Wireless Internet Phone TV

Highlights

  • Complaints about TELUS increased by 43%, a significant increase compared to a 14% increase in complaints for all service providers.
  • TELUS accounts for 12% of all accepted complaints, up from 10% last year and 7% the year before.
  • TELUS’ wireless issues increased by 48%, a significant increase compared to the 7% increase in wireless issues across all service providers. Wireless issues account for 57% of TELUS’ issues.
  • TELUS’ internet issues increased by 29% more than last year. Overall, internet issues decreased by 6% across all service providers. Internet issues account for 23% of TELUS’ issues.
  • TV issues account for 9% of all TELUS issues, down from 11% last year. However, TELUS’ customers raised 21% more TV issues than last year, compared to a decrease of 13% over all the service providers.
  • Disclosure issues returned to first place as the most complained-about issue accounting for 15.7% of all TELUS’ issues.
  • Issues about incorrect charges declined to the second most-raised issues for TELUS accounting for 15.5% of all TELUS issues even though its customers raised it 49% more often than last year.
  • TELUS’ Code breaches continue to significantly outpace all other service providers, with a total of 21 confirmed Code breaches this year.
    • TELUS had four Wireless Code breaches. Two of those four involved TELUS not giving required notice to customer before disconnection.
    • With three confirmed Internet Code breaches this year, TELUS contributes to 37.5% of the overall Internet Code breaches. All the confirmed breaches of the Internet Code are about failure to provide customers with the required notice before making changes to other contract terms and conditions.
    • TELUS had 13 TVSP Code breaches, which account for 93% of all confirmed TVSP Code breaches. Twelve of TELUS’ breaches were about changes to the customer’s programming options.

Statistics

1,798 accepted complaints
43.2% change in accepted complaints 12.3% of all accepted complaints
1,585 resolved complaints
1,454 resolved at pre-investigation or initial referral 131 resolved at conciliation or investigation 89.6% resolution rate
(Global – 89%)
Top 3 issues across all service types
16% disclosure issues 15% incorrect charge for monthly price plan 10% quality of service
21 Code breaches
4 Wireless Code breaches 4 Internet Code breaches 13 TVSP Code breaches 0 D&D Code breaches

Fido (Rogers group)

Wireless Internet

Highlights

  • Complaints about Fido increased by 28%. This is significant, given the 14% increase in complaints for all service providers.
  • Fido accounts for 12% of all accepted complaints, up from 10% last year.
  • Fido’s wireless-related issues account for 91% of all its issues, down from 93% last year.
  • Internet issues account for 9% of Fido’s total issues, up from 8% last year.
  • Issues about incorrect charges related to the monthly price plan was the most-increased issue raised by Fido customers, with a 45% increase compared to last year. This is of concern when compared to a 1% increase in the same issue across all service providers. Issues with incorrect charges account for 16% of all Fido’s issues, up from 13% last year.
  • Another two increasingly-raised issues by Fido customers are roaming charges (up by 144%) and issues about credit or refund not received (up by 85%).
  • Fido had two confirmed breaches of the Wireless Code this year. One of the two breaches was about Fido not including all the information required by the Wireless Code in its contract with the customer. The other confirmed breach was about changes to key contract terms.

Statistics

1,704 accepted complaints
28.3% change in accepted complaints 11.7% of all accepted complaints
1,496 resolved complaints
1,337 resolved at pre-investigation or initial referral 159 resolved at conciliation or investigation 91.6% resolution rate
(Global – 89%)
Top 3 issues across all service types
21% disclosure issues 16% incorrect charge for monthly price plan 9% credit/refund not received
2 Code breaches
2 Wireless Code breaches 0 Internet Code breaches 0 D&D Code breaches

Koodo (TELUS group)

Wireless

Highlights

  • Complaints about Koodo increased by 23% compared to a 14% increase in complaints for all service providers.
  • Koodo accounts for 7% of all accepted complaints, the same as last year.
  • Koodo’s wireless issues increased by 18%, compared to a 7% increase in wireless issues across all service providers.
  • Koodo’s top issue is incorrect charge related to monthly price plan, which increased by 33% this year. Koodo has seen an increase in this issue over the past six years.
  • Notably, Koodo’s quality of service issues increased by 40%, compared to a decrease of 3% in quality of service issues across all service providers. Quality of service issues account for 7% of Koodo’s issues, up from 6% last year.
  • Koodo had five confirmed Wireless Code breaches this year, down from eight last year. Two breaches were about issues during the trial period. The other breaches are due to Koodo’s failure to provide a Critical Information Summary, not providing the permanent (paper or electronic) copy of the contract to the customer; and not giving notice or all required information to the customer before disconnection.

Statistics

1,016 accepted complaints
22.7% change in accepted complaints 7.0% of all accepted complaints
952 resolved complaints
872 resolved at pre-investigation or initial referral 80 resolved at conciliation or investigation 90.3% resolution rate
(Global – 89%)
Top 3 issues across all service types
15% incorrect charge for monthly price plan 15% disclosure issues 7% credit reporting
5 Code breaches
5 Wireless Code breaches 0 D&D Code breaches

Freedom Mobile (Quebecor group)

Wireless Internet

Highlights

  • Complaints about Freedom Mobile increased for the first time in four years. This year Freedom Mobile’s complaints increased by 11%, compared to a 14% increase in complaints for all service providers.
  • Freedom Mobile accounts for 6% of all accepted complaints, unchanged from last year.
  • The vast majority of Freedom Mobile’s issues continue to be about wireless services, representing 97% of all its issues, down from 98% last year. Freedom began offering internet services in 2019 and we recorded 38 issues about its internet services this year.
  • The top three issues raised by Freedom Mobile customers were: disclosure issues (15% of Freedom Mobile’s issues), incorrect charge of monthly price plan (11% of Freedom Mobile’s issues), and roaming charges (9% of Freedom Mobile’s issues).
  • Freedom Mobile had four confirmed breaches of the Wireless Code, down from 12 last year. The four breaches account for 8% of all confirmed breaches of the Wireless Code. Three of its breaches are about disconnection issues like failure to give required notice or information to the customer before disconnection. One breach was about its failure to suspend roaming data charges once they reached $100.

Statistics

837 accepted complaints
11.2% change in accepted complaints 5.7% of all accepted complaints
785 resolved complaints
736 resolved at pre-investigation or initial referral 49 resolved at conciliation or investigation 92.9% resolution rate
(Global – 89%)
Top 3 issues across all service types
15% disclosure issues 11% incorrect charge for monthly price plan 9% roaming charges
4 Code breaches
4 Wireless Code breaches 0 Internet Code breaches 0 D&D Code breaches

Virgin Plus (Bell group)

Wireless Internet Phone

Highlights

  • Complaints about Virgin Plus decreased by 11%, despite a 14% increase in complaints for all service providers.
  • Virgin Plus accounts for 6% of all accepted complaints, down from 7% last year.
  • Wireless issues decreased by 29%, and account for 82% of all Virgin Plus’ issues.
  • Virgin Plus’ internet issues decreased by 22% in contrast to the decrease of 7% of internet issues across all service providers. Internet issues account for 16% of Virgin Plus’ issues.
  • Disclosure issues are still the most complained-about issue for Virgin Plus, accounting for 15% of all Virgin Plus issues.
  • There was a significant decrease in issues relating to incorrect charges (28% decrease), credit reporting (45% decrease) and device financing plans (68% decrease).
  • Virgin Plus had 14 confirmed Code breaches, up from 13 last year.
    • Virgin Plus had 13 confirmed breaches of the Wireless Code, up from 11 last year, accounting for 27% of all the confirmed Wireless Code breaches. Nine breaches were about not providing customers all required information or notice before disconnection. Two breaches were related to not providing a Critical Information Summary and two breaches were about failure to provide required information in the contract.
    • The single Internet Code breach was about a disconnection issue.

Statistics

836 accepted complaints
-11.2% change in accepted complaints 5.7% of all accepted complaints
700 resolved complaints
531 resolved at pre-investigation or initial referral 169 resolved at conciliation or investigation 87.7% resolution rate
(Global – 89%)
Top 3 issues across all service types
16% disclosure issues 12% incorrect charge for monthly price plan 8% credit/refund not received
14 Code breaches
13 Wireless Code breaches 1 Internet Code breaches 0 D&D Code breaches

Videotron (Quebecor group)

Wireless Internet Phone TV

Highlights

  • Complaints about Videotron decreased by 20% compared to a 14% increase in complaints for all service providers.
  • Videotron accounts for 3% of all accepted complaints, down from 5% last year.
  • Videotron’s wireless issues decreased by 29% while overall wireless issues increased by 7% across all service providers. Wireless issues account for 34% of all Videotron issues, up from 26% last year.
  • Videotron’s internet issues decreased by 45%, while overall internet issues decreased by 7%. Internet issues account for 34% of all Videotron issues, unchanged from last year.
  • TV-related issues decreased by 57% for Videotron, while TV issues across all service providers decreased by 13%. TV issues account for 21% of all Videotron issues, down from 27% last year.
  • The top three issues raised by Videotron customers were disclosure issues (18% of Videotron’s issues), incorrect charge (16% of Videotron’s issues), and issues with changes to the contract (7% of Videotron’s issues).
  • Videotron had three confirmed Wireless Code breaches this year, compared to 10 last year. These Wireless Code breaches represent 6% of all Wireless Code breaches. These breaches are related to Videotron’s failure to provide customers with all required information or notice before disconnection.

Statistics

490 accepted complaints
-19.7% change in accepted complaints 3.4% of all accepted complaints
413 resolved complaints
363 resolved at pre-investigation or initial referral 50 resolved at conciliation or investigation 90.2% resolution rate
(Global – 89%)
Top 3 issues across all service types
19% disclosure issues 16% incorrect charge for monthly price plan 7% changes to the contract
3 Code breaches
3 Wireless Code breaches 0 Internet Code breaches 0 TVSP Code breaches 0 D&D Code breaches

Shaw (Rogers group)

Wireless Internet Phone TV

Highlights

  • Complaints about Shaw decreased by 22% compared to a 14% increase in complaints for all service providers.
  • Shaw accounts for 3% of all accepted complaints, down from 4% from last year and 5% the year before.
  • Internet issues were the top complained-about service by Shaw’s customers despite decreasing by 31% from last year. By comparison, internet issues decreased by 7% across all service providers. Internet issues account for 52% of Shaw’s issues.
  • TV issues account for 25% of Shaw’s issues. Shaw’s TV issues decreased by 31%, compared to a 13% decrease of TV issues across all providers.
  • Wireless issues account for 11% of all Shaw’s issues, down from 14% last year. Notably, Shaw’s wireless issues decreased by 49%, even though there was a 7% increase in wireless issues across all service providers.
  • The top three issues raised by Shaw’s customers were: quality of service (17% of Shaw’s issues), disclosure issues (12% of Shaw’s issues), and issues with incorrect charges (10% of Shaw’s issues).
  • Shaw had eight confirmed breaches of the Wireless Code, up from five last year. Five of the breaches were about Shaw’s failure to provide a permanent (paper or electronic) copy of the contract to customers, or the contract did not include all the information listed in the Wireless Code. The remaining three breaches were about not providing required information in the Critical Information Summary.

Statistics

435 accepted complaints
-22.0% change in accepted complaints 3.0% of all accepted complaints
366 resolved complaints
317 resolved at pre-investigation or initial referral 49 resolved at conciliation or investigation 88.2% resolution rate
(Global – 89%)
Top 3 issues across all service types
17% quality of service 12% disclosure issues 10% incorrect charge for monthly price plan
8 Code breaches
8 Wireless Code breaches 0 Internet Code breaches 0 TVSP Code breaches 0 D&D Code breaches

Fizz (Quebecor group)

Wireless Internet

Highlights

  • Complaints about Fizz increased by 20% compared to a 14% increase in complaints for all service providers. This is the third year that complaints about Fizz increased.
  • Fizz accounts for 1% of all accepted complaints, the same as last year. This marks the first time Fizz has been one of our top 10 most complained about providers and marks the highest number of complaints for the service provider in three years.
  • Wireless issues represent 67% of all Fizz’s issues.
  • Fizz’s internet issues increased by 70% this year. This is significant given that there was a 7% decrease in internet issues across all providers. Fizz’s internet issues account for 33% of Fizz’s issues.
  • This year, the increase in Fizz’s wireless and internet issues are predominantly driven by service delivery issues related to installation or cancellation due dates not kept or delay, complete loss of service, and quality of service. Quality of service issues were the top issue raised by Fizz’s customers and account for 18% of its issues.
  • Fizz had no confirmed Code breaches this year.

Statistics

190 accepted complaints
19.5% change in accepted complaints 1.3% of all accepted complaints
175 resolved complaints
161 resolved at pre-investigation or initial referral 14 resolved at conciliation or investigation 92.1% resolution rate
(Global – 89%)
Top 3 issues across all service types
18% quality of service 13% due dates not kept/delay 10% complete loss of service
0 Code breaches
0 Wireless Code breaches 0 Internet Code breaches

Monitoring service provider compliance

There are two categories of service provider requirements: the CRTC requirement to participate in the CCTS, and the CCTS requirements that a service provider agrees to when it becomes a Participating Service Provider (PSP).

To ensure the CCTS can provide free and effective service to customers when they need it, the CRTC requires providers of retail telecom services in Canada and licensed TV service providers to participate in the CCTS.

Some service providers, typically small providers or new entrants to the industry, do not currently participate. However, they are required to join when one of their customers files a complaint with the CCTS. We also receive requests from some service providers who voluntarily choose to participate in the CCTS.

We do everything in our power to facilitate service providers joining the CCTS and we’re generally successful. This past year, the CCTS updated its sign-up process requirements and ceased charging a sign-up fee to further simplify sign-ups for small service providers.

In 2022-23, we signed up 23 new service providers and it took, on average, 44 days to sign up a new service provider.

Unfortunately, some providers refuse to join the CCTS. If we’re unable to persuade them to follow the CRTC regulatory requirement to become a PSP, we refer the matter to the CRTC for further action. In 2022-23, the CRTC initiated a show cause proceeding against Optitel Mobile for failing to sign up with the CCTS when required to do so. The CRTC also issued two decisions about previously referred service providers that failed to sign up. It determined that Haute-Vitesse.com was no longer operating but found it had contravened the Telecommunications Act for a specific period of time when it was required to join the CCTS. It also ordered telecommunications service provider Net2Web to join the CCTS within 60 days of the order. Net2Web failed to join the CCTS and the CCTS advised the CRTC accordingly.

After a provider has become a PSP, it is required to adhere to the obligations outlined in the CCTS Participation Agreement, including:

The CCTS regularly monitors PSP compliance with these obligations and engages with PSPs to bring them into compliance. If a PSP continues to be non-compliant, the CCTS has a range of enforcement tools to seek compliance, up to and including the expulsion of non-compliant PSPs from the CCTS. This triggers a referral to the CRTC for further action.

In April 2023, the CCTS terminated the participation of ICA Micro-Systems Inc. (ICA) for non-compliance with participation requirements, notably failing to implement a CCTS-issued Decision. ICA has since re-joined the CCTS after rectifying all non-compliance issues, including issuing a refund to the customer as was required by the CCTS’ Decision.

In July 2023, we issued the annual Compliance Monitoring Report, which explains the compliance requirements in detail, provides the results of the CCTS’ compliance monitoring efforts in 2022, and discusses trends observed in the past few years. The CCTS also regularly updates our non-compliant providers webpage, where we publish the names of providers that have been referred to the CRTC for failure to join the CCTS when required, or that were expelled from the CCTS for failing to comply with CCTS obligations.