Topics and Trends
Annual Report
August 1, 2022 – July 31, 2023
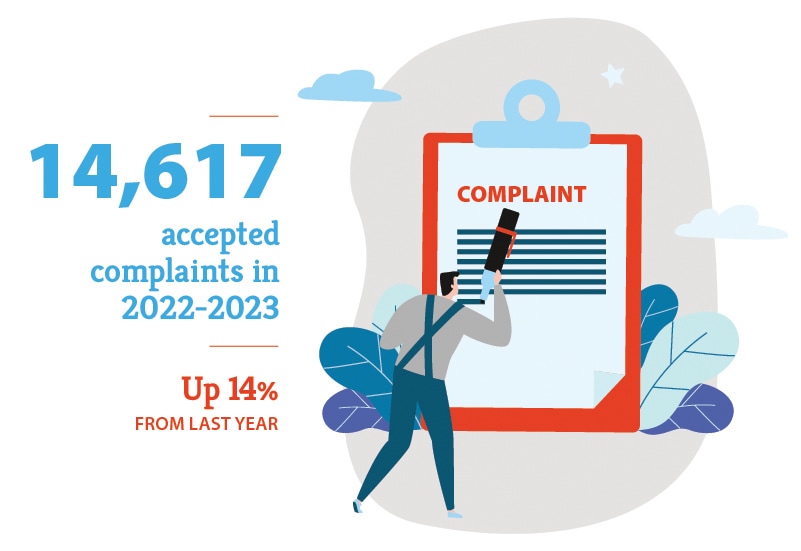
In 2022-23, we accepted 14,617 complaints filed by customers across Canada. This represents a 14% increase from last year.
Overview
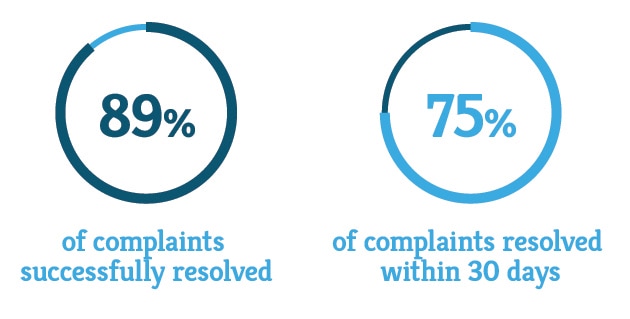
During this year of transformation, we successfully maintained a high-resolution rate of 89%.
We resolved 75% of all complaints within 30 days.
Issues raised in complaints
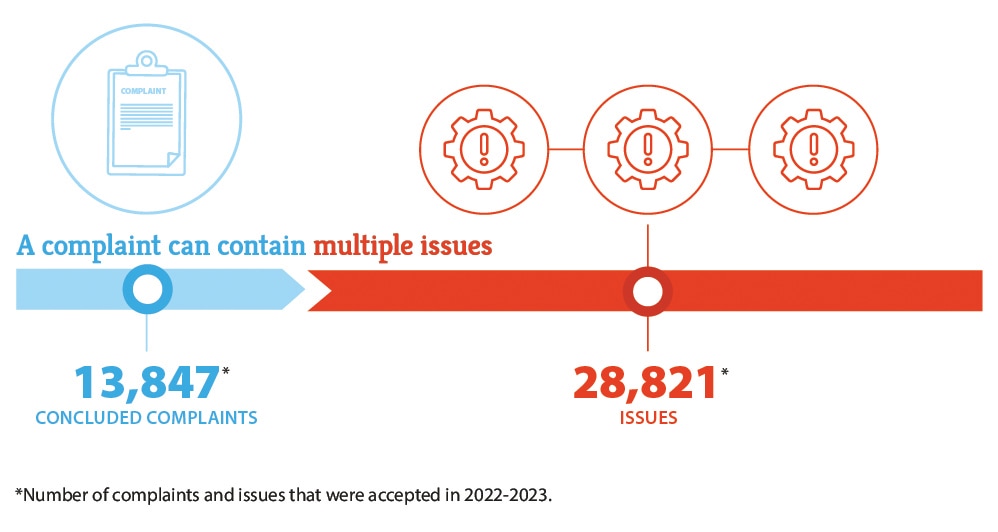
This year, 28,821 issues were raised in 13,847 concluded complaints. A single complaint can contain multiple issues. For example, a customer may submit one complaint about both the billing of their internet service and roaming charges related to their wireless service, which would be reported as two issues.
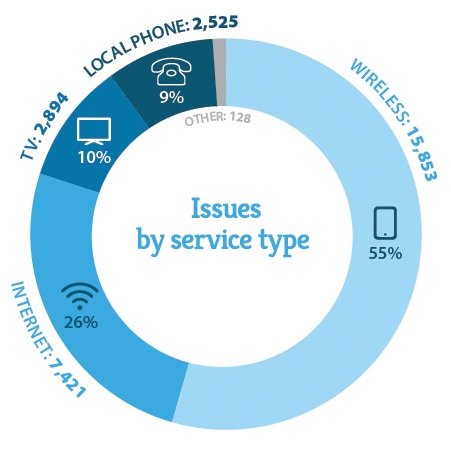
Wireless issues remain the most-raised issue, representing 55% of all issues raised. Wireless issues increased by 6% compared to last year. Internet issues returned to the second most-raised issue, accounting for 26% of all issues raised.
As part of our transformation process, we reviewed and simplified our “nature of incident” classification system. Reporting on issues this year is based on the new classification system. Refer to Appendix D, which provides mapping of old issue names to new issue names.
Spotlight on wireless services
- Wireless remains the most complained-about service. Wireless issues increased by 6% from last year.
- Wireless issues account for 55% of all issues raised, up from 51% last year.
- Billing remains the top category of issues for wireless services, representing 44% of wireless issues. Wireless billing issues increased by 11%.
- Contract dispute issues, and service delivery categories followed, comprising 30% and 22% of wireless complaint issues, respectively.
- Disclosure issues remain a top issue raised by wireless customers. Disclosure issues account for 18% of all wireless issues, up from 15% last year. Wireless disclosure issues decreased by 2% from last year.
- Notably, wireless complete loss of service issues increased by 93%.
- Issues relating to wireless roaming charges also increased by 98%.
| Issue | Number | Proportion | YoY (%) |
|---|---|---|---|
| Disclosure issues | 2,839 | 18% | -2% |
| Monthly price plan – Incorrect charge | 2,170 | 14% | 16% |
| Quality of service | 1,152 | 7% | 8% |
| Credit or refund not received | 1,019 | 6% | 31% |
| Roaming charges | 851 | 5% | 98% |
| Changes to the contract | 784 | 5% | 32% |
| Breach of contract | 756 | 5% | -16% |
| 3rd party credit reporting | 650 | 4% | -12% |
| Due dates not kept or delay for installation or cancellation of service | 554 | 3% | 8% |
| Complete loss of service | 487 | 3% | 93% |
Spotlight on internet services
- Internet issues account for 26% of all issues raised by customers.
- Internet issues declined by 7% and this is the second year in a row that internet issues declined.
- Service delivery is the top category of issues for internet services, representing 41% of all internet issues.
- Despite a decrease in overall internet issues, internet service delivery issues increased by 5%. This increase is driven by significant increases in issues related to complete loss of service, a 48% increase, and unable to cancel, a 72% increase. Meanwhile, the top service delivery issue continues to be quality of service, which decreased by 13% and accounts for 16% of internet issues.
- Billing continues to be the second most-raised category of issue, accounting for 33% of all internet service issues.
| Issue | Number | Proportion | YoY (%) |
|---|---|---|---|
| Quality of service | 1,183 | 16% | -13% |
| Monthly price plan – Incorrect charge | 922 | 12% | -9% |
| Disclosure issues | 766 | 10% | -13% |
| Due dates not kept or delay for installation or cancellation of service | 621 | 8% | -3% |
| Complete loss of service | 554 | 8% | 48% |
| Credit or refund not received | 479 | 7% | 18% |
| Changes to the contract | 301 | 4% | 11% |
| Termination fee | 271 | 4% | -30% |
| Breach of contract | 266 | 4% | -28% |
| Unable to cancel | 253 | 3% | 72% |
Spotlight on TV services
- For the fourth consecutive year, the number of TV issues decreased.
- TV issues account for 10% of all issues raised in 2022-23.
- Although down in overall complaints, billing remains the top category of issues raised by customers of TV services, representing 39% of all issues about TV services.
- Incorrect charge relating to the monthly price plan remains the top billing issue for TV customers, accounting for 14% of TV issues.
- Service delivery is the second most-raised category of issues by TV customers, accounting for 35% of TV issues.
- Quality of service is the top service delivery issue, accounting for 14% of all TV issues, a 3% increase from last year.
- Complete loss of service issues increased by 33% since last year.
| Issue | Number | Proportion | YoY (%) |
|---|---|---|---|
| Monthly price plan – Incorrect charge | 417 | 14% | -17% |
| Quality of service | 390 | 13% | 3% |
| Disclosure issues | 346 | 12% | -24% |
| Due dates not kept or delay for installation or cancellation of service | 210 | 7% | -9% |
| Complete loss of service | 173 | 6% | 33% |
| Credit or refund not received | 168 | 6% | -7% |
|
Changes to the contract
|
150 | 5% | -11% |
| Equipment charges | 98 | 3% | -37% |
| 3rd party credit reporting | 97 | 3% | -22% |
| Breach of contract | 94 | 3% | -24% |
Spotlight on phone services
- Local phone services (landlines) account for 9% of all issues and are down 17% from last year. Phone issues have decreased consistently for four years in a row.
- Service delivery remains the top category of issues, accounting for 43% of all issues raised about local phone services.
- Quality of service was the second most-raised issue by local phone customers, accounting for 12% of local phone issues. Phone quality of service issues decreased by 4% from last year.
- Billing remains the second most-raised category of issues.
- Notably, issues related to incorrect charge relating to monthly price plan remains the top issue for phone customers accounting for 12% of local phone issues.
- Issues related to complete loss of service were the most-increased local phone issue, up 20% from last year.
| Issue | Number | Proportion | YoY (%) |
|---|---|---|---|
| Monthly price plan – Incorrect charge | 313 | 12% | -22% |
| Quality of service | 301 | 12% | -4% |
| Disclosure issues | 249 | 10% | -22% |
| Complete loss of service | 231 | 9% | 20% |
| Due dates not kept or delay for installation or cancellation of service | 178 | 7% | -18% |
| Unable to port | 145 | 6% | 4% |
| Termination fee | 114 | 5% | -42% |
| Credit or refund not received | 114 | 5% | -12% |
| Changes to the contract | 106 | 4% | -12% |
| Regular price increase of monthly price plans | 73 | 3% | 3% |
Breakdown of issues across all service types
Disclosure issues continue to be the top issues raised by all customers, followed by complaints about incorrect billing of their monthly price plans.
Contract dispute issues
Disclosure issues
Customers often raise concerns about information not being fully or clearly provided. This is reflected in the data, as disclosure issues continue to be the top issue. Disclosure issues were raised 4,222 times this year across all service types and account for 15% of all issues raised across all service types. Disclosure issues decreased for the third year in a row and decreased by 8% from last year.

Note: As part of our transformation process, we reviewed and simplified the nature of incident classification system. Reporting on issues this year is based on the updated classification system.
Disclosure issues by type of service
The lack of clear disclosure is the top issue raised by wireless customers and is the number three issue for internet, TV, and phone customers.
Disclosure issues are raised disproportionately by wireless customers. Although wireless customers account for 55% of all issues raised, they account for 67% of disclosure issues.
* The average disclosure resolution rate was 89%.
The top disclosure issue is no consent or contract conflicts with agreement, which occurs when a customer is not made aware that they were entering into an agreement with a provider, or there is a conflict or mismatch between what a customer has agreed to purchase and what their contract indicates. This type of disclosure issue accounts for 78% of disclosure issues, up from 76% last year.
The second biggest disclosure issue is rules related to agreement being unclear, which is about a conflict or a mismatch in the customer’s understanding of the rules related to the agreement, such as information about promotion details not fully disclosed, plan eligibility requirements not disclosed, or details about manufacturer’s warranty or extended warranty coverage not clearly disclosed. This type of disclosure issue accounts for 17% of all disclosure issues. This issue decreased by 5% from last year.
No consent or contract conflicts with agreement
Of all disclosure issues raised, 78% are the result of a conflict or mismatch between whether the customer consented to the agreement, or what the customer believes they agreed to purchase and what is indicated in the contract sent to them after the transaction occurred.
This type of disclosure issue was raised 3,295 times.
| Service provider | Number of times issue was raised | Proportion of issue |
|---|---|---|
| Rogers | 681 | 21% |
| Bell | 535 | 16% |
| TELUS | 499 | 15% |
Rules related to agreement are unclear
A common disclosure issue occurs when the rules related to agreement are unclear. This issue accounts for 17% of all disclosure issues.
Wireless customers raised a disproportionately high number of issues regarding the clarity of agreement-related rules.
| Service provider | Number of times issue was raised | Proportion of issue |
|---|---|---|
| Rogers | 165 | 24% |
| Fido | 132 | 19% |
| Bell | 86 | 12% |
Device financing plans
In March 2021, the CRTC issued a decision determining that device financing plans fall under the scope of the Wireless Code. The CRTC found that the required repayment of the balance of a device financing plan ultimately constitutes an early cancellation fee for the purposes of the Wireless Code. To inform future reviews of the Wireless Code, the CRTC requested that the CCTS begin tracking complaints related to device financing plans in our Annual and Mid-Year Reports.
Overall, there was a 31% decrease in device financing plan issues from last year. The proportion of this issue to overall issues raised in 2022-23 is 0.8%, down from 1.2% last year.
Changes to the contract
Issues regarding changes to the contract occur when a service provider notifies the customer about a change to the terms of their agreement that the customer does not believe the provider is allowed to make, or the provider fails to provide required advance notice to the customer about a change to the terms of their agreement.
This issue accounts for 5% of all issues raised. This past year, issues about changes to the contract increased by 17%. There was a disproportionate increase in changes to contract issues for wireless services. While changes to contract issues for wireless services increased by 32%, overall wireless issues increased by 8%.
This year, 58% of changes to contract issues were raised by wireless customers, up from 51% last year.
| Service provider | Number of times issue was raised | Proportion of issue |
|---|---|---|
| Rogers | 259 | 19% |
| Bell | 237 | 18% |
| Fido | 183 | 14% |
Breach of contract
Service providers are required to follow their own terms of service, agreements with customers, and any specific offers they have made to a customer. If a service provider fails to follow their contractual requirements, we consider it a breach of contract.
This year contract breaches were the third most-raised contract dispute issue, accounting for 15% of all contract dispute issues and down from 17% last year. Overall complaints about breach of contract decreased by 21% from last year. Of the issues raised, 64% were by wireless customers and 22% by internet customers.
| Service provider | Number of times issue was raised | Proportion of issue |
|---|---|---|
| Rogers | 243 | 20% |
| Bell | 193 | 16% |
| Fido | 145 | 12% |
Billing issues
Billing issues were raised 11,379 times in 2022-23 and accounted for 39% of all issues raised, maintaining the same percentage as the previous year.
Complaints about billing issues for wireless services continued to rise, and now account for 60% of billing issues, up from 54% last year.
While overall billing issues decreased by 1% year-over-year, wireless billing issues increased by 11%. This 11% increase is driven by increases to issues about roaming charges (up by 98%), credit or refund not received (up by 19%), pay per use services (up by 139%) and third-party charges (up by 60%).
* The average billing resolution rate was 90%.
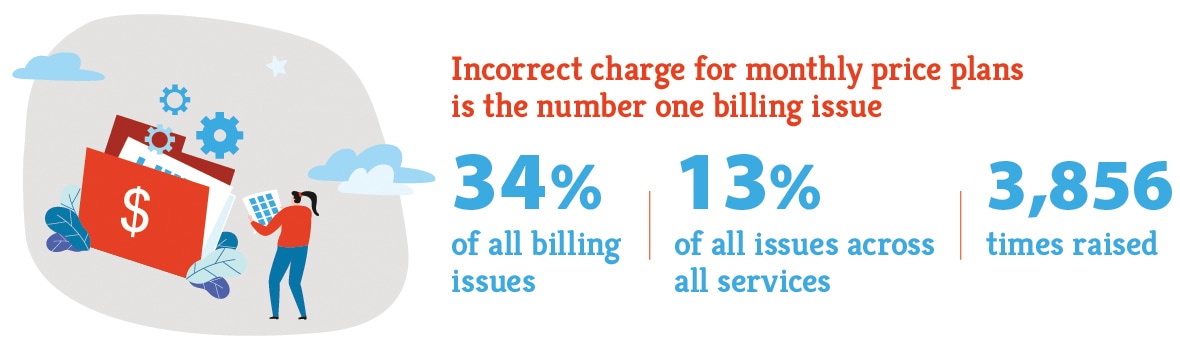
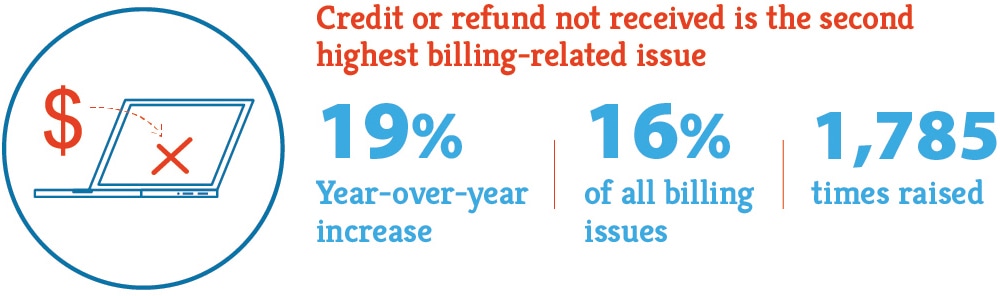
Incorrect charges relating to monthly price plans remain the number one billing issue, accounting for 34% of all billing issues. Credit or refund not received is number two, accounting for 16%.
Notably, issues related to roaming charges moved from eighth position to third position in the top ten billing issues. It now accounts for 8% of billing issues, up 4% from last year.
| Issue | Number |
|---|---|
| Monthly price plan – Incorrect charge | 3,856 |
| Credit or refund not received | 1,785 |
| Roaming charges | 851 |
| Deactivation charges or billed after cancellation | 612 |
| Equipment charges | 538 |
| Regular price increase of monthly price plans | 503 |
| Data charges | 411 |
| Installation, activation, or reactivation charges | 379 |
| Chargeable messages | 338 |
| Invoices not received | 327 |
Incorrect charge relating to monthly price plan
In 2022-23, 34% of all billing issues were about customers being charged incorrectly for their monthly price plans.
Continuing a three-year increase, wireless services account for 56% of incorrect charge issues, up from 50% last year. Wireless customers raised issues about incorrect charges relating to their monthly price plan 16% more often this year.
| Service provider | Number of times issue was raised | Proportion of issue |
|---|---|---|
| Rogers | 883 | 23% |
| Bell | 628 | 16% |
| TELUS | 585 | 15% |
Credit or refund not received
Concerns about not receiving a promised credit or refund were the second biggest billing issue.
This issue accounts for 16% of all billing issues, up from 13% last year. The number of times the customers raised issues about credit or refund not being received increased 19% year over year.
While this issue decreased for all other services, wireless services saw a significant 16% increase in this issue compared to last year.
| Service provider | Number of times issue was raised | Proportion of issue |
|---|---|---|
| Rogers | 431 | 24% |
| Bell | 279 | 16% |
| TELUS | 266 | 15% |
Roaming charges
Issues with roaming charges increased significantly, by 98%, nearly doubling compared to last year after doubling the year before. This accounts for 8% of billing issues, up from 4% last year. The increase has seen this issue move from eighth position to third position in the top 10 billing issues.
| Service provider | Number of times issue was raised | Proportion of issue |
|---|---|---|
| Fido | 217 | 26% |
| TELUS | 139 | 16% |
| Freedom Mobile | 134 | 16% |
Service delivery issues
Service delivery issues increased by 10% from last year despite a 2% decrease in all issues reported. Service delivery issues account for 30% of all issues raised, 8,605 issues raised this year.
Of all service delivery issues raised, 40% were about wireless services. Internet customers account for 35% of service delivery issues, down from 37% last year. However, given that internet customers make up 26% of all issues raised, this is a disproportionately high number of service delivery issues raised by internet customers.
Wireless service delivery issues increased by 18%, which is a disproportionate increase considering overall service delivery issues increased by 10%.
Rogers now accounts for the most service delivery issues, with 22% of all service delivery issues. Bell ranks second, accounting for 17% and TELUS third, accounting for 12% of service delivery issues.
Notably, TELUS and Fizz experienced a significant increase in service delivery issues this year.
* The average service delivery resolution rate was 87%.
Quality of service issues remain the top service delivery issue. Issues with quality of service account for 35% of all service delivery issues.
Due dates not kept or delayed for installation or cancellation of service is the second most-raised service delivery issue, accounting for 18% of service delivery issues, down from 21% last year.
Complete loss of service is the third-highest service delivery issue. This accounts for 17% of all service delivery issues, up from 12% last year. Complete loss of service is the most-increased service delivery issue, up by 53% from last year.
| Issue | Number |
|---|---|
| Quality of service | 3,033 |
| Due dates not kept or delayed for installation or cancellation of service | 1,569 |
| Complete loss of service | 1,450 |
| Unable to cancel | 704 |
| Unable to port | 511 |
| Nonpayment or collections | 417 |
| Installation error | 339 |
| Repair issues and appointments | 162 |
| Our of service due to policy | 113 |
| Service not working | 74 |
“I felt supported in resolving the dispute with my internet provider. It was quick and done in a professional manner. Thank you for being there!”
Quality of service issues
Customers raise quality of service issues when their telecommunications or television services are not working to the service level that they expect. These are some common examples:
- slower than expected internet or wireless data speeds
- intermittent service such as service not being continuous, working on and off with regular or irregular interruptions, or
- call quality issues such as static or clips with their wireless or landline phone service.
Customers raised concerns about the quality of their service 3,033 times this past year. Quality of service remains the number one service delivery issue. This accounts for 35% of all service delivery issues.

For internet customers, quality of service issues continue to be the leading concern, accounting for 16% of all internet issues. Internet customers also account for the highest proportion of quality of service issues at 39%, down from 44% last year.
For wireless customers, quality of service issues account for 38% of all wireless issues reported, up 4% from last year. Wireless quality of service issues increased by 8% this year.
| Service provider | Number of times issue was raised | Proportion of issue |
|---|---|---|
| Rogers | 704 | 23% |
| Bell | 548 | 18% |
| TELUS | 371 | 12% |
While there was an overall decrease in quality of service issues, Rogers and TELUS both saw a year-over-year increase in the number of issues raised around quality of service, 26% and 35% respectively.
Complete loss of service
This past year, complete loss of service represented the most-increased service delivery issue, increasing by 53% from last year. Complete loss of service was the third highest service delivery issue, accounting for 17% of all service delivery issues.
Internet customers reported the highest proportion of complete loss of service issues at 38%. Complete loss of service for internet customers increased by 48% from last year.
Wireless customers account for 34% of complete loss of service issues. Complete loss of service for wireless services increased by 93% from last year.
| Service provider | Number of times issue was raised | Proportion of issue |
|---|---|---|
| Rogers | 414 | 29% |
| Bell | 221 | 15% |
| TELUS | 133 | 19% |
Rogers accounts for the highest proportion of complete loss of service issues at 29%. Rogers also saw a 138% increase in the number of issues raised about complete loss of service.
Unable to cancel and unable to port services
This year, we noticed that customers raised more issues with leaving or switching their service providers because they were unable to cancel their wireless or internet services or unable to port (transfer) their phone services to another provider.
Notably, unable to cancel issues increased by 31% from last year, most significantly with wireless and internet customers this past year. These issues are about customers who request to cancel their services, but the provider refuses, or a system error prevents the cancellation. The occurrence of issues where customers could not port their service increased by 23%. Among these complaints, 71% were wireless customers and 29% were local phone services. We will continue to monitor these issues as customers ought to be able to easily cancel or switch their services and providers.
Credit management issues
Credit management issues like credit reporting and security deposits account for 4% of all issues. Credit management issues were raised 1,121 times this year and decreased by 17% year-over-year.
Credit reporting issues
The vast majority, about 94%, of credit management issues are about third-party credit reporting. The number of credit reporting issues decreased by 16% from last year. Wireless customers account for 62% of all credit reporting issues, up from 59% last year.
| Service provider | Number of times issue was raised | Proportion of issue |
|---|---|---|
| Rogers | 207 | 20% |
| Bell | 180 | 17% |
| TELUS | 178 | 17% |
“Excellent service. I felt understood as a consumer and felt like I had a voice. I was happy to receive a response within a few days. I was quickly satisfied. Great job.”